
FIGURE 4.
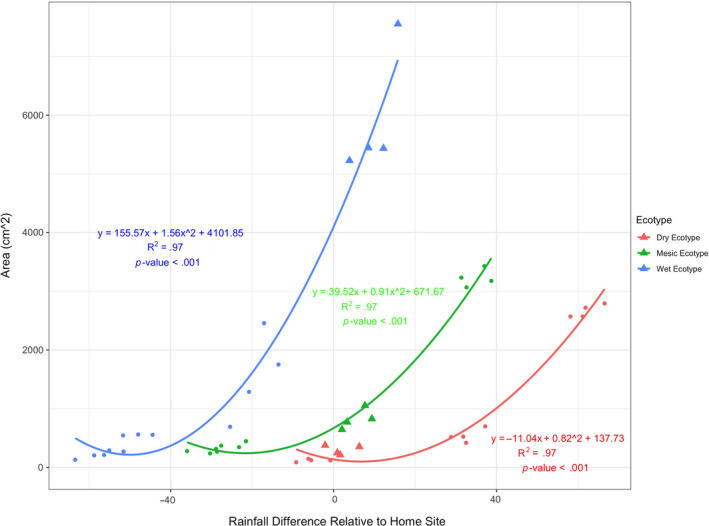
Fitted quadratic regression lines for canopy area (cm2) relative to difference in rainfall at the homesite for wet, mesic, and dry ecotypes, compared to rainfall at population source of origin. Note that the homesite is depicted by triangles