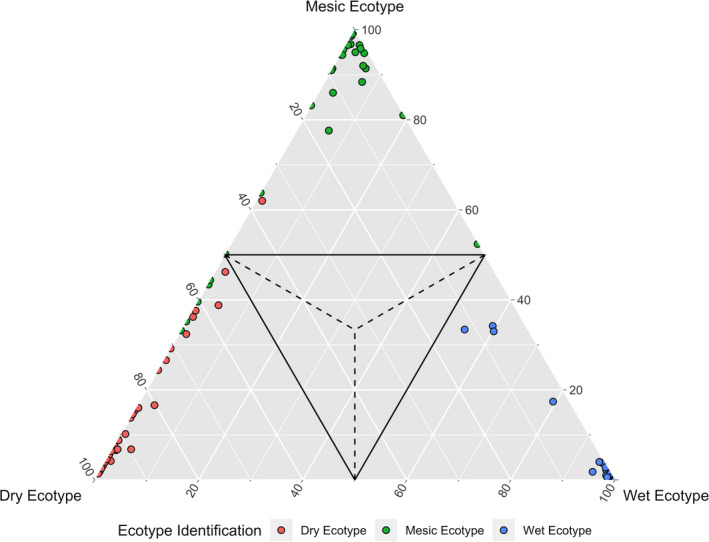
FIGURE 6.

Classification plot obtained from the random forest analyses showing training/validation triangle with percent votes of the individuals from the 10 fold‐cross validation from random forest training and validation set. Each point is an individual. Dry ecotype is denoted in red, mesic ecotype is denoted in green, and wet ecotype is denoted in blue. Individuals within the solid lines indicate individuals with poor discernment of the algorithm (<50% votes). Plants falling outside of the solid lines are clearly discerned; that is, more than 50% of votes from the validation were for that ecotype
