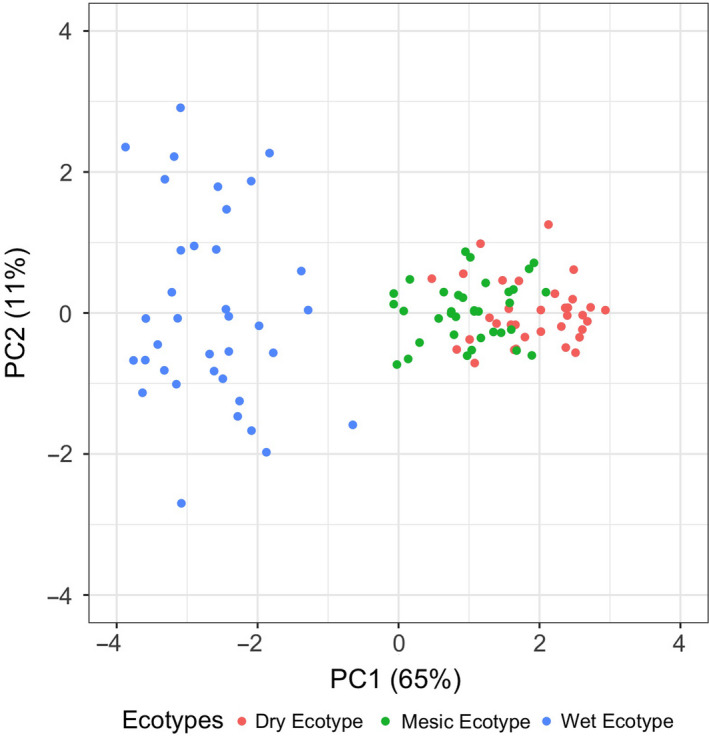
FIGURE 7.

Scatter plot of the first two principal component scores for vegetative and reproductive traits corresponding to 106 plants corresponding to ecotypes growing in their homesite. Abbreviations and symbols correspond to regional ecotypes (Red = dry ecotype from Central Kansas; Green = mesic ecotype from Eastern Kansas; Blue = wet ecotype from Illinois). Mesic and dry ecotypes in their home environments were differentiated from the wet ecotype in Illinois prairies mostly along the first PCA axis
