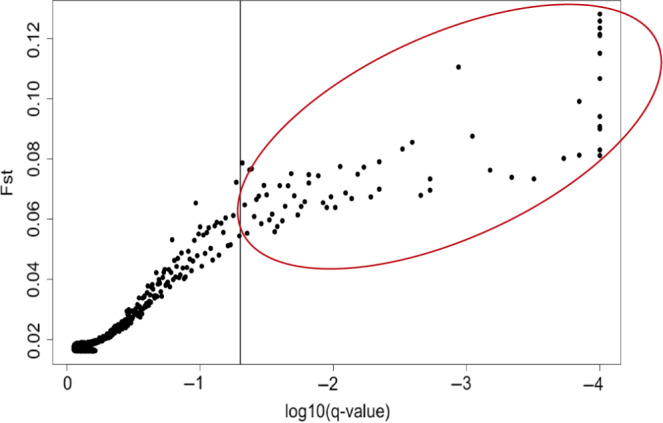
FIGURE 9.

Scatter plot of Fst values as a function of statistical significance of SNP markers, as obtained using Bayescan v2.1. Points to the right of the vertical line indicates 64 markers with significant evidence of divergent selection among populations based on a q‐value (i.e., p‐value adjusted for FDR) lower than .05
