
FIGURE 10.
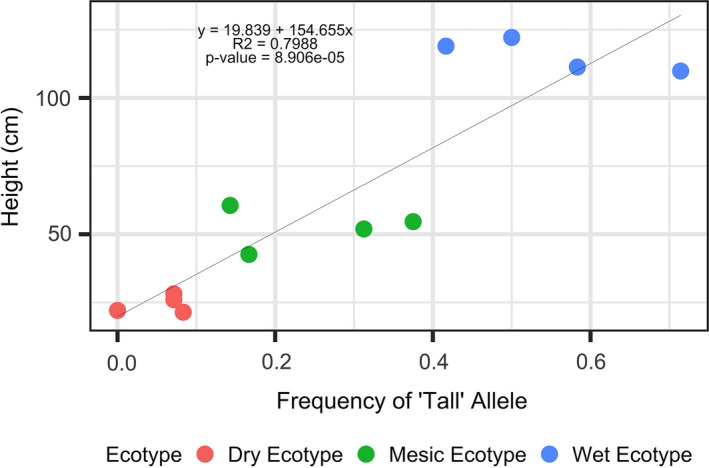
Scatter plot and fitted regression line depicting average population plant height as a function of allelic frequency for the “tall” allele of the GA1 outlier. Each population is color‐coded by ecotype. Red = dry ecotype, green = mesic ecotype, blue = wet ecotype. The four points per ecotype represent the four source populations