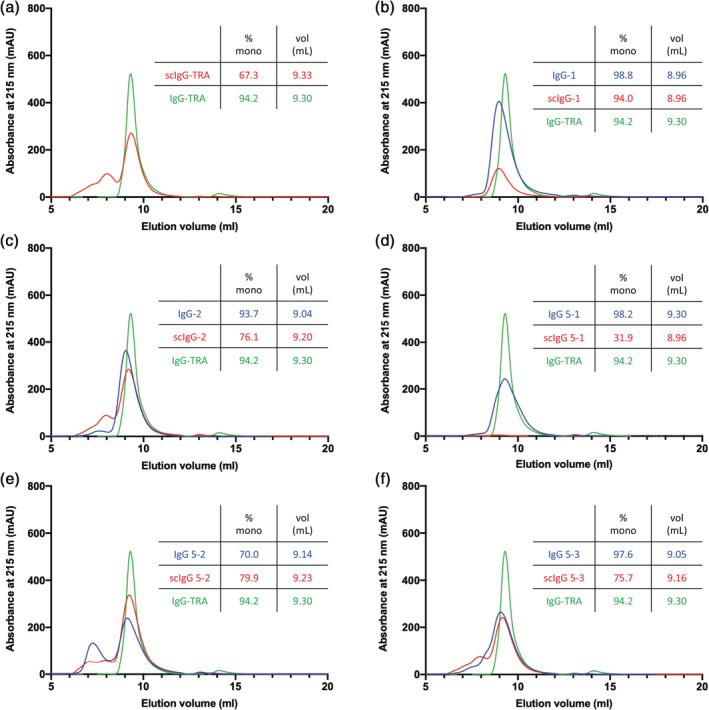
FIGURE 2.

Size‐exclusion chromatography of immunoglobulin G (IgG) and single‐chain IgG (scIgG) proteins. Chromatograms are shown for 5–6.7 μM samples of IgG (blue) and scIgG (red) versions of (a) in‐house produced scIgG‐formatted trastuzumab, (b) anti‐MBP Ab‐1, (c) anti‐Gaussia luciferase Ab‐2, (d) anti‐Her2 clone 5‐1, (e) anti‐Her2 clone 5‐2, and (f) anti‐Her2 clone 5‐3, along with the well‐behaved IgG Trastuzumab (IgG‐TRA, green) as a marker for monomeric IgG. Samples were applied on a Tosoh TSKgel BioAssist G3SWxl column. Percent monomer (% mono) was calculated from the area under the monomer peak (y‐axis) and the elution volume (vol [ml], x‐axis) was calculated at the maximum height of the monomer peak
