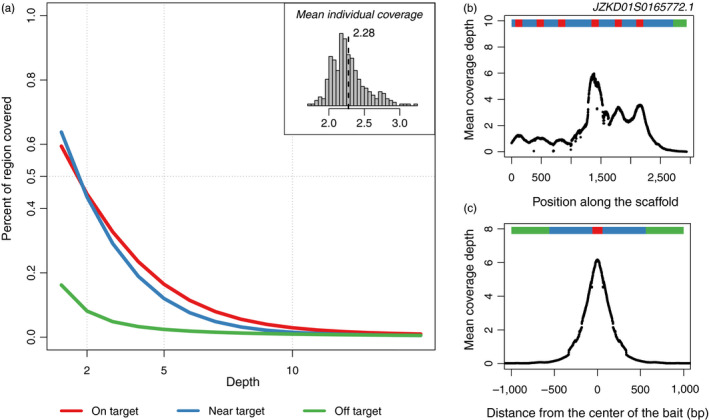
Figure 2.

Whole‐exome capture results with the cumulative distribution of coverage for on‐target, near‐target (<500 bp from a bait region), and off‐target (>500 bp from a bait region) loci (a). The mean individual coverage along one scaffold (JZKD01S0165772.1) (b) and the mean nucleotide coverage across all scaffolds for on‐target, near‐target, and off‐target regions (c)
