
FIGURE 3.
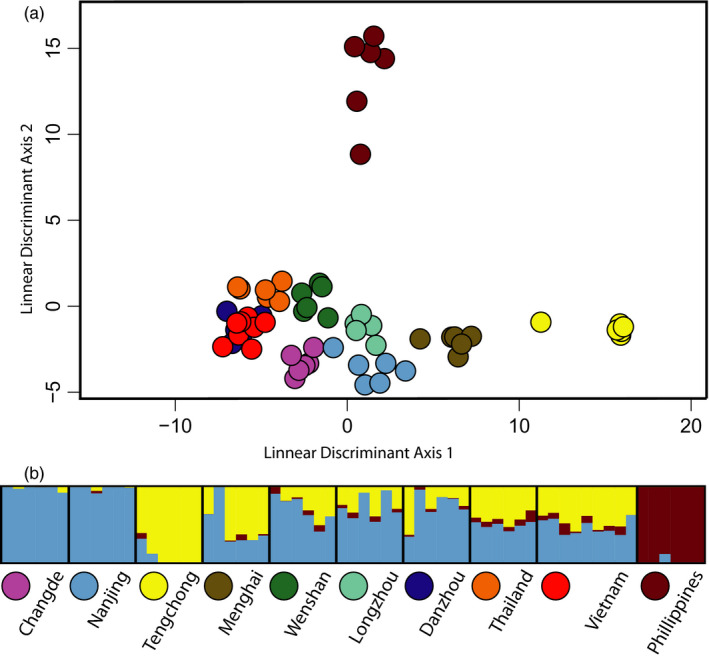
(a) Discriminant analysis of principal components (DAPC) of the snp genotype data maximizing genetic differences across defined populations. (b) Admixture analysis based on the genotype likelihood data using NGSadmix to infer admixture proportions. Each bar is one individual, and the colours represent the posterior probability of assignment to each of three putative “population” clusters