FIGURE 5.

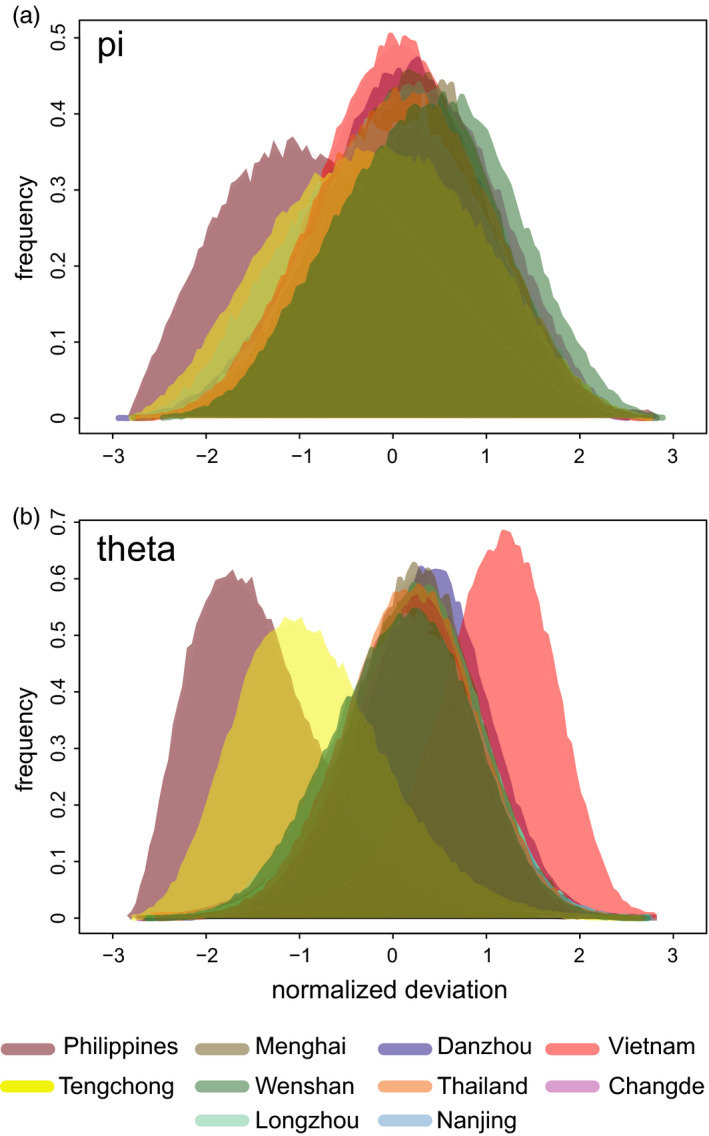
Genomic diversity. Plots of the normalized deviation from mean diversity measures pi (a), and theta (b), raw histograms shown

Genomic diversity. Plots of the normalized deviation from mean diversity measures pi (a), and theta (b), raw histograms shown