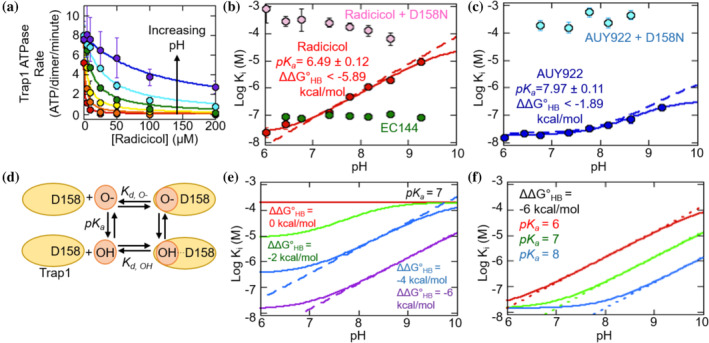
FIGURE 4.

(a) IC50 curves of radicicol for Trap1 at pH values between 6.02 and 9.27 (from low to high pH: red, orange, yellow, green, blue, violet). Measurements were performed with 1 mM ATP. Solid lines are fits with Equation (2). Error bars are the SEM for at least 2 measurements. (b) The pH‐dependence of radicicol inhibition with wild‐type and D158N Trap1 and of EC144 with wild‐type Trap1. The solid line is a fit to Equation (4). Error bars are the fitting error from at least 3 measurements. (c) The pH‐dependence of the Log Ki of AUY922 with wild‐type and D158N Trap1. The solid line is a fit to Equation (4). Error bars are the fitting error from Equation (2) for at least two measurements. (d) Scheme of the model for the pH‐dependence of radicicol binding. (e) Numerical simulations illustrating the influence of variable hydrogen‐bonding energy on pH‐dependent inhibition. Solid lines are calculated using Equation (4). Fixed parameters are K d,O‐ at 2 × 10⁻⁴ M and pK a at 7. (f) Numerical simulations illustrating the influence of variable inhibitor pK a values on pH‐dependent inhibition. Solid lines are calculated using Equation (4). Fixed parameters are K d,OH at 1.4 × 10⁻⁸ M and K d,O‐ at 2 × 10⁻⁴ M
