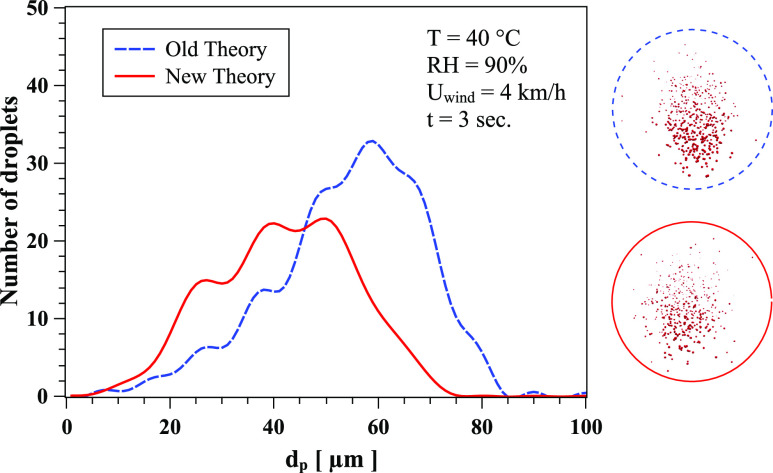
FIG. 5.
The effect of Nusselt and Sherwood correlations on the evaporation and local distribution of saliva droplets at t = 3 s, RH = 90%, T = 40 °C, and Uwind = 4 km/h. The circles show the corresponding form of the cloud dispersion obtained from CFD simulations. Dashed line circle: old theory; solid line circle: new theory.

