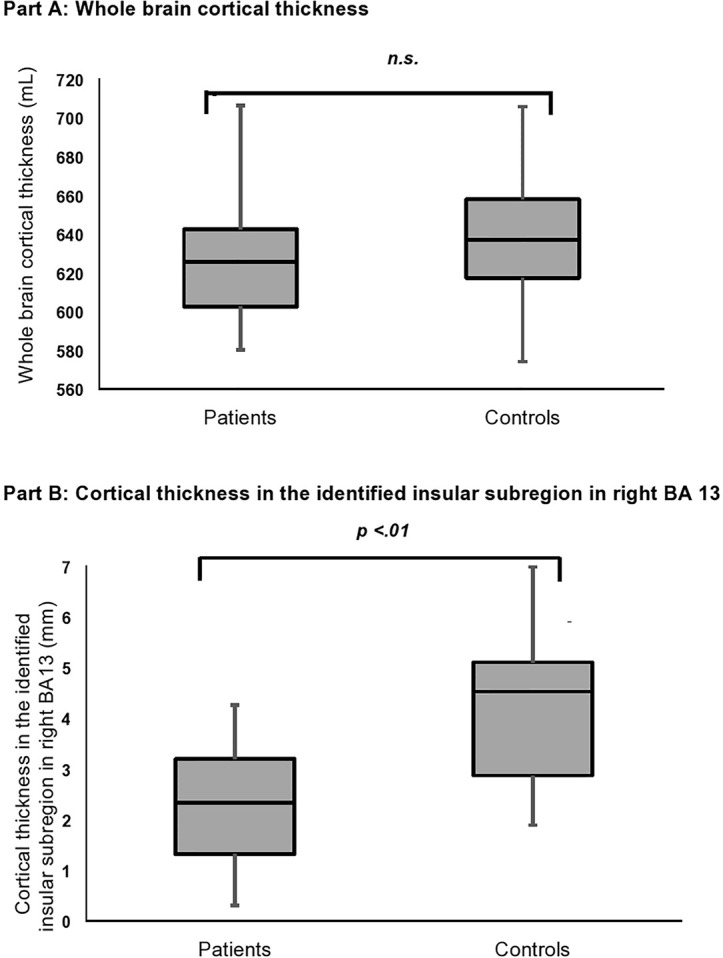
Figure 1.

Bar charts represent the whole brain cortical thickness (A) and the cortical thickness in the identified insular subregion in BA 13 (B) for patients and healthy controls. The median is shown as a line in the center of each box, the bar denotes the first (Q1) and third (Q3) quartile and the whiskers mark the minimum and maximum.
