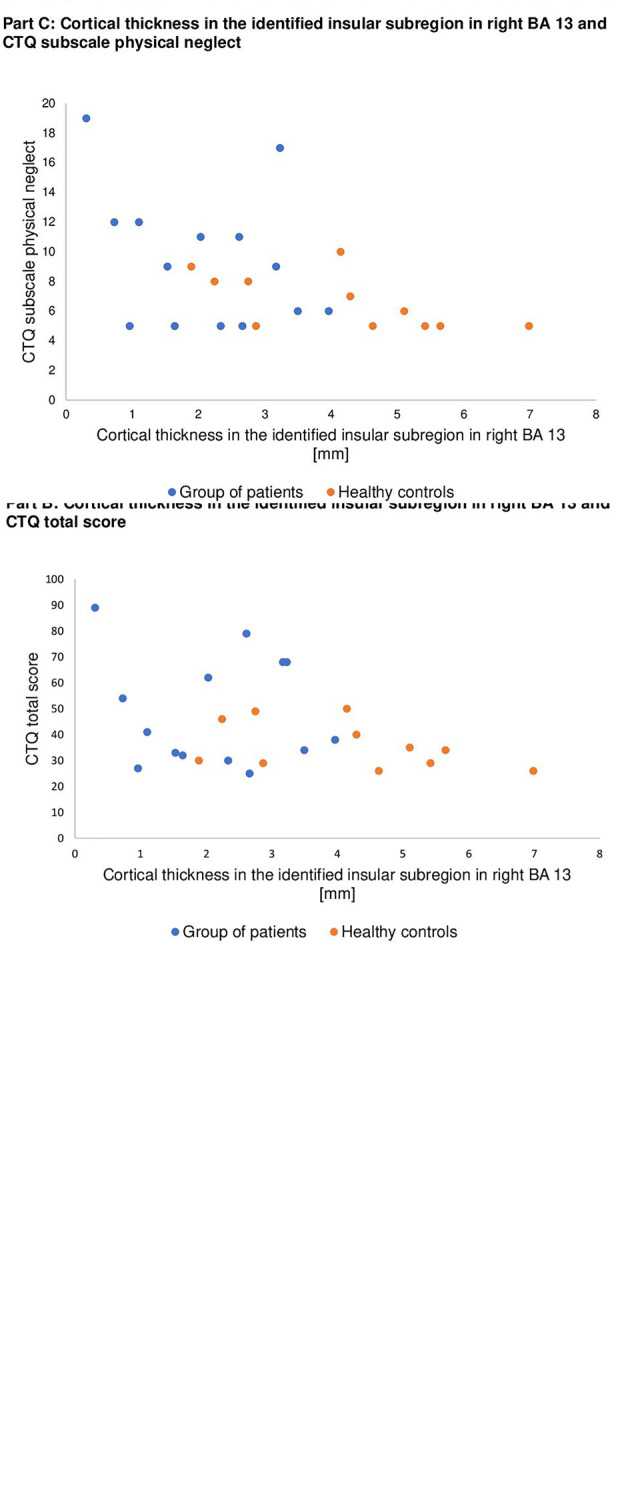
Figure 2.

Scatter plots illustrating relationships between cortical thickness in the identified insular subregion in right BA 13 on the x-axis and symptom severity (Part A), CTQ total score (Part B), and CTQ subscale physical neglect (Part C) on the y-axis separately for patients (blue dots) and healthy controls (orange dots).
