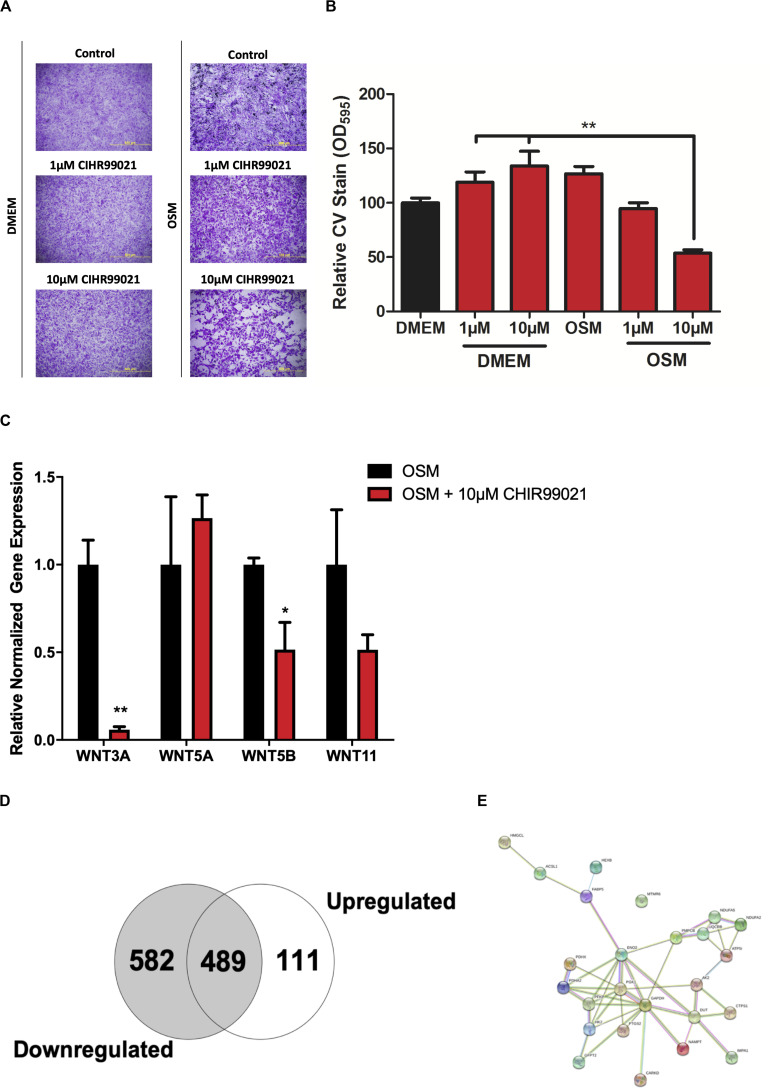
FIGURE 4.
Proteomic profiling of HAVICs treated with CHIR99021. (A) Representative images of CV staining in HAVICs treated with CHIR99021 in DMEM or OSM. (B) Quantification of CV staining. The data are represented as mean ± SEM. Significance level was set at P < 0.05. *P < 0.05, **P < 0.01 compared to the specified group; n = 6 HAVIC lines were used for each group. One-way ANOVA followed by Tukey’s post hoc multiple comparisons test was used for statistical analysis. (C) mRNA expression of Wnt ligands after treatment with CHIR99021. The data are represented as mean ± SEM. Significance level was set at P < 0.05. *P < 0.05, **P < 0.01 compared to OSM groups; n = 3 HAVIC lines were used for each group. Students t-test was used for statistical analysis. (D) Venn diagram representing the number of differentially expressed proteins in HAVICs treated with CHIR99021 for 3 weeks in OSM compared to cells incubated in OSM alone. Fischer’s exact t-test was used for statistical analysis. (E) Network graphic of the highly enriched gene ontology biological process organophosphate metabolic processes. HAVICs, human aortic valve interstitial cells; CV, crystal violet; OSM, osteogenic media.

