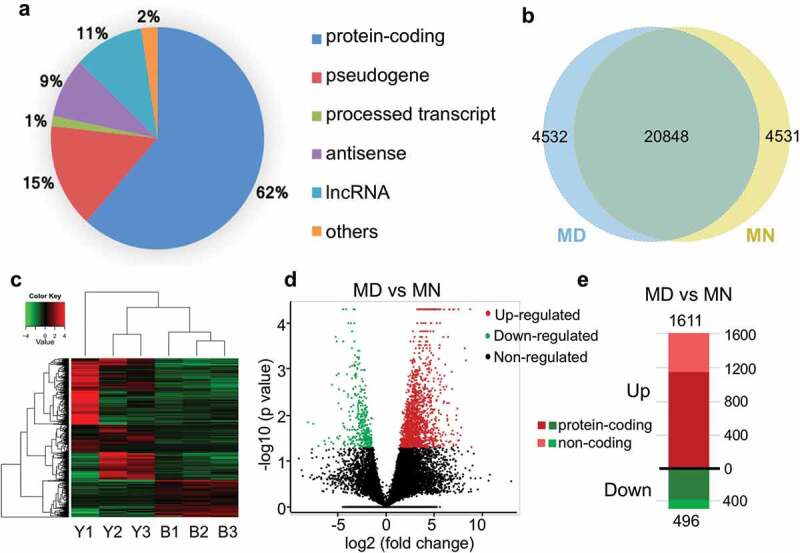
Figure 1.

Characteristics and differences between transcriptomes from human MD and MN oocytes. (a) Statistics of expressed transcripts, with the majority being protein-coding genes and pseudogenes. Long non-coding RNAs (lncRNAs), processed transcripts, antisense RNAs and some other transcripts were also detected. (b) Venn diagram indicating the numbers of overlapping genes between MD and MN groups. (c) Unsupervised hierarchical clustering based on transcriptome characteristics. (d) A volcano plot depicting significantly upregulated or downregulated genes between the 2 groups. (e) Compared with the MN group, 1611 and 496 transcripts were upregulated (shown in red) and downregulated (shown in green) in MD oocytes, respectively. Dark colors represent protein-coding genes and light colors represent non-coding genes.
