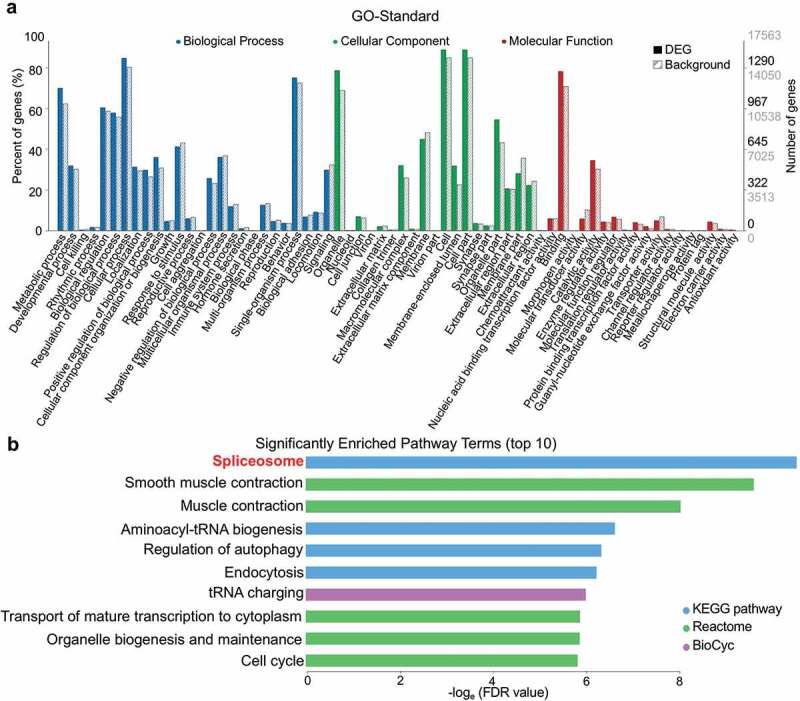
Figure 2.

Enriched GO terms and pathways based on DEGs. (a) Distribution of 64 GO terms according to DEGs. Twenty-six terms of biological process, 19 terms of cellular component, and 19 terms of molecular function are colored blue, green, and red, respectively. Full bars represent the number of DEGs in the recent study; dashed bars represent the numbers of total expressed background genes. Right vertical axis, the numbers of DEGs and background genes; left vertical axis, the percentage of annotated GO-term genes relative to background genes. (b) The top-10 significantly enriched pathway terms (both upregulated and downregulated) according to FDR values.
