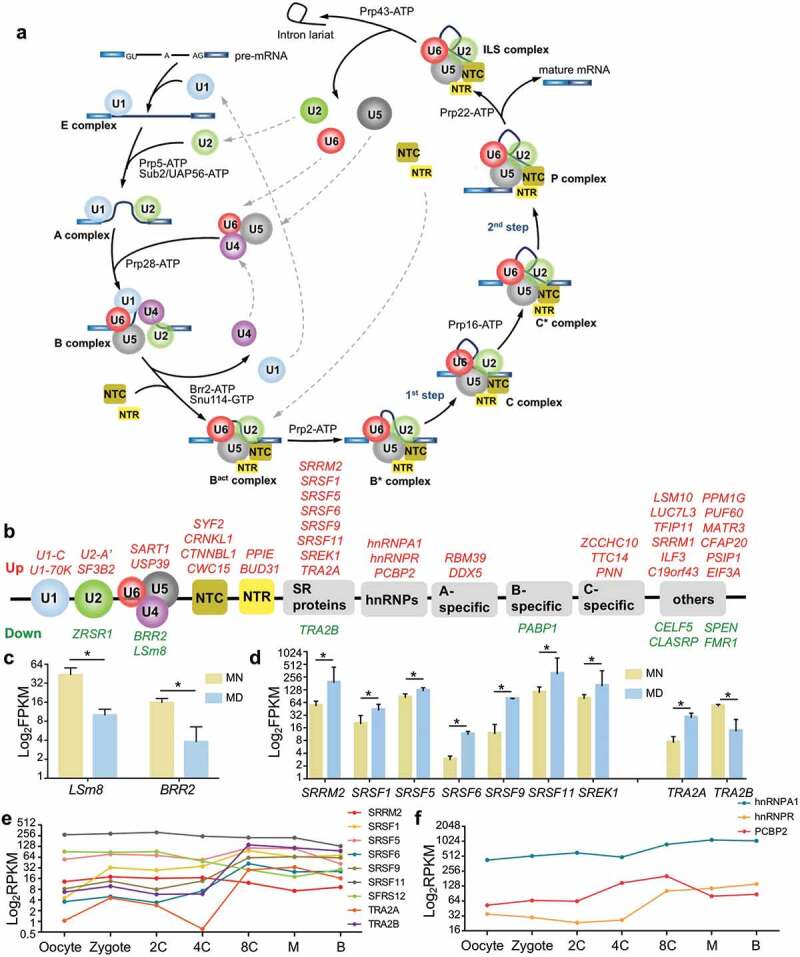
Figure 3.

Pre-mRNA splicing and differentially expressed spliceosomal proteins. (a) Cartoon of a representative splicing cycle. (b) DEGs belong to both core snRNP sub-complexes and regulatory splicing factors. Upregulated genes are presented in red and downregulated genes in green. (c-d) Expression of LSm8 and BRR2 (c), and of SR and hnRNP genes (d). For a clearer display, the vertical axis was adjusted to log2 FPKM, and the same adjustment was used below. Error bar, standard deviation. *, p <0.05. (e-f) Expression pattern of SR proteins (e) and hnRNPs (f) during early embryonic development. 2 C, 2-cell; 4 C, 4-cell; 8 C, 8-cell; M, morula; B, blastocyst. Expression values were calculated as RPKMs (reads per kilobase transcriptome per million reads), which were also used in the original literature.
