Figure 5.

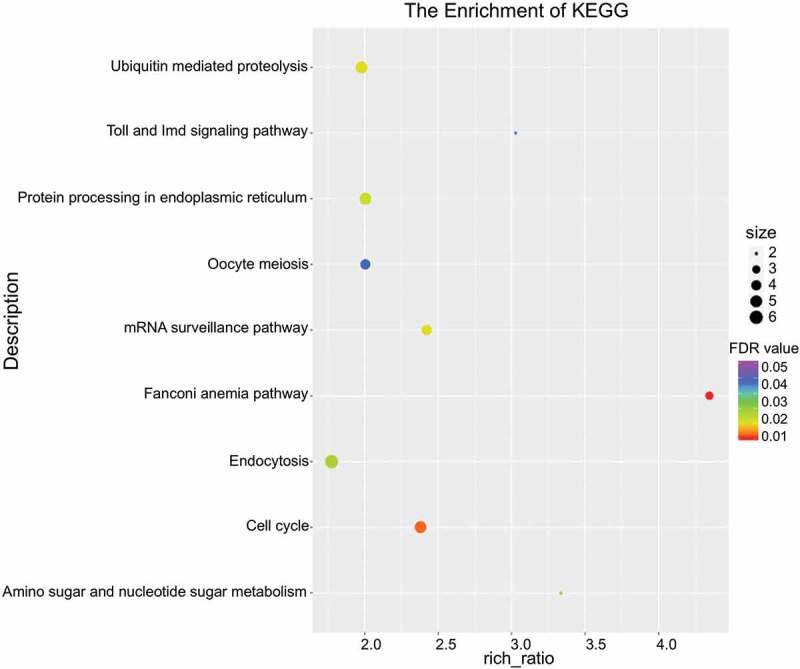
Enriched pathways of genes by DAS. Bubble chart indicating KEGG pathway enrichment for the genes featured by DAS and calculated with FDR values.

Enriched pathways of genes by DAS. Bubble chart indicating KEGG pathway enrichment for the genes featured by DAS and calculated with FDR values.