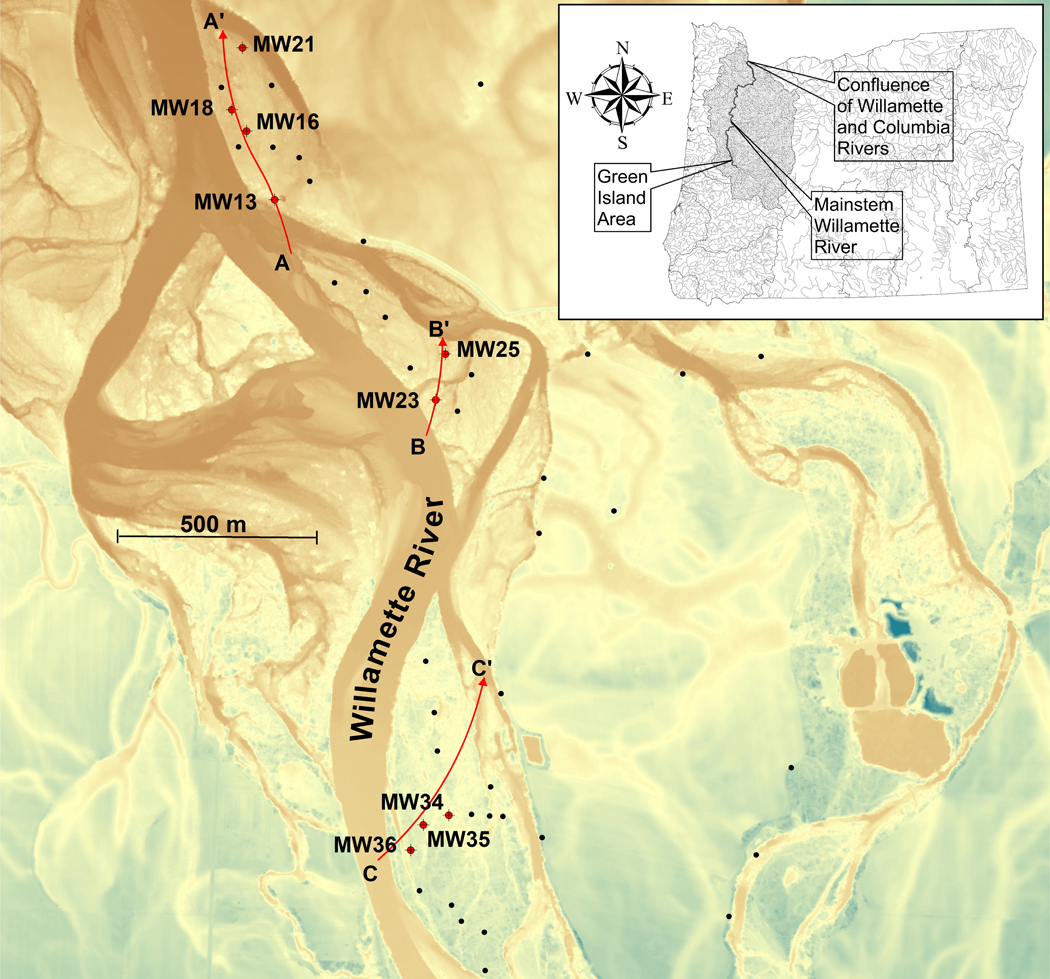
Figure 1:

Map of Green Island, with the base map in the form of a bare earth LiDAR image. LiDAR is essentially radar which has been adapted to use light rather than radio frequencies. This map shows locations of our study wells along transects and the selected steady-state pathlines for the dry season. Black dots indicate locations of all constructed wells. The labeled red dots indicate wells whhich were located along the pathlines.
