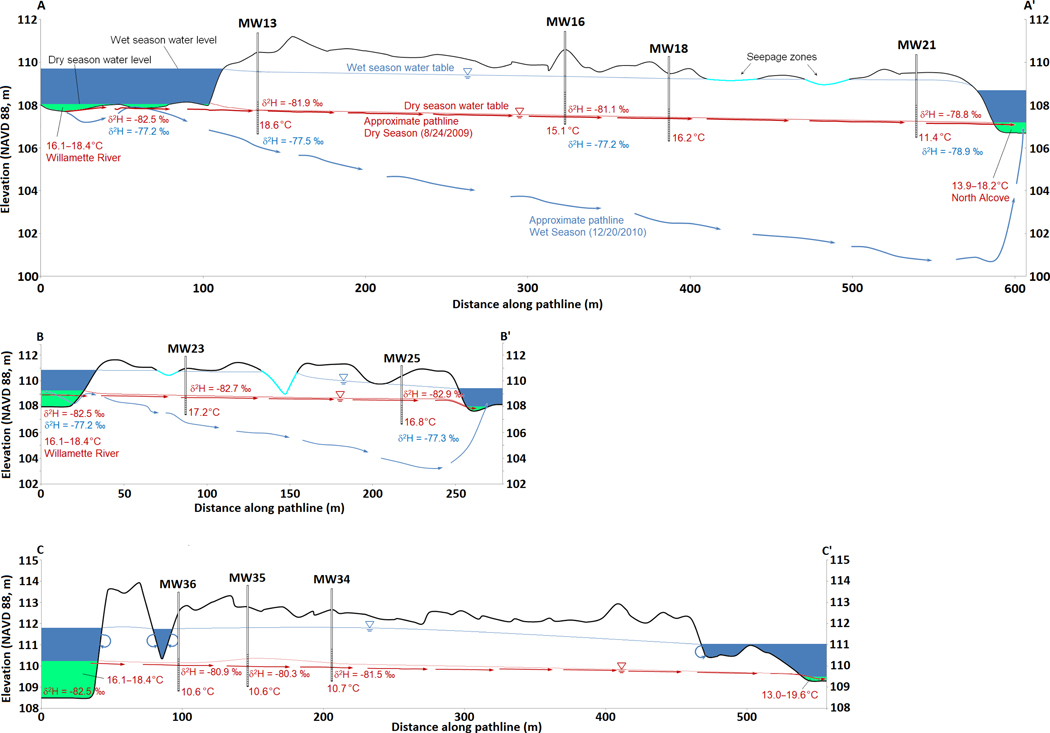
Figure 5:
Schematic of hyporheic pathlines traversing distance 0 to L through islands along river riparian zones. Cross-sections (Fig. 1) are A-A’ (north), B-B’ (middle), and C-C’ (south). The flow pathlines and water levels are derived from the MODFLOW/MODPATH results along each cross-section. Pathlines and values shown in blue represent the wet season observations versus red, for the dry season. Note magnification of vertical scale.

