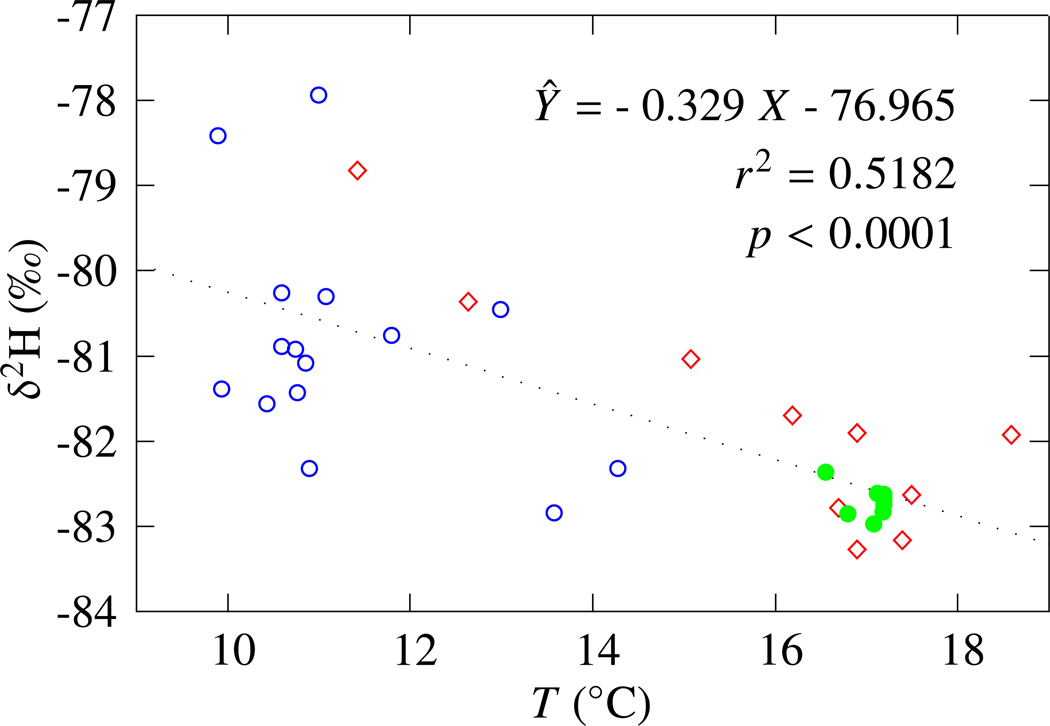
Figure 7:
Stable isotope values as a function of temperature for all of the wells inside the hyporheic zone (the areas outlined in Fig. 4). Only data from dry-season quarterly sampling were used. Symbols are  North island,
  Middle island,
  South island. The p-value is the approximate probability, based on the F-distribution. Note that the color scheme used here has nothing to do with those of previous figures.

