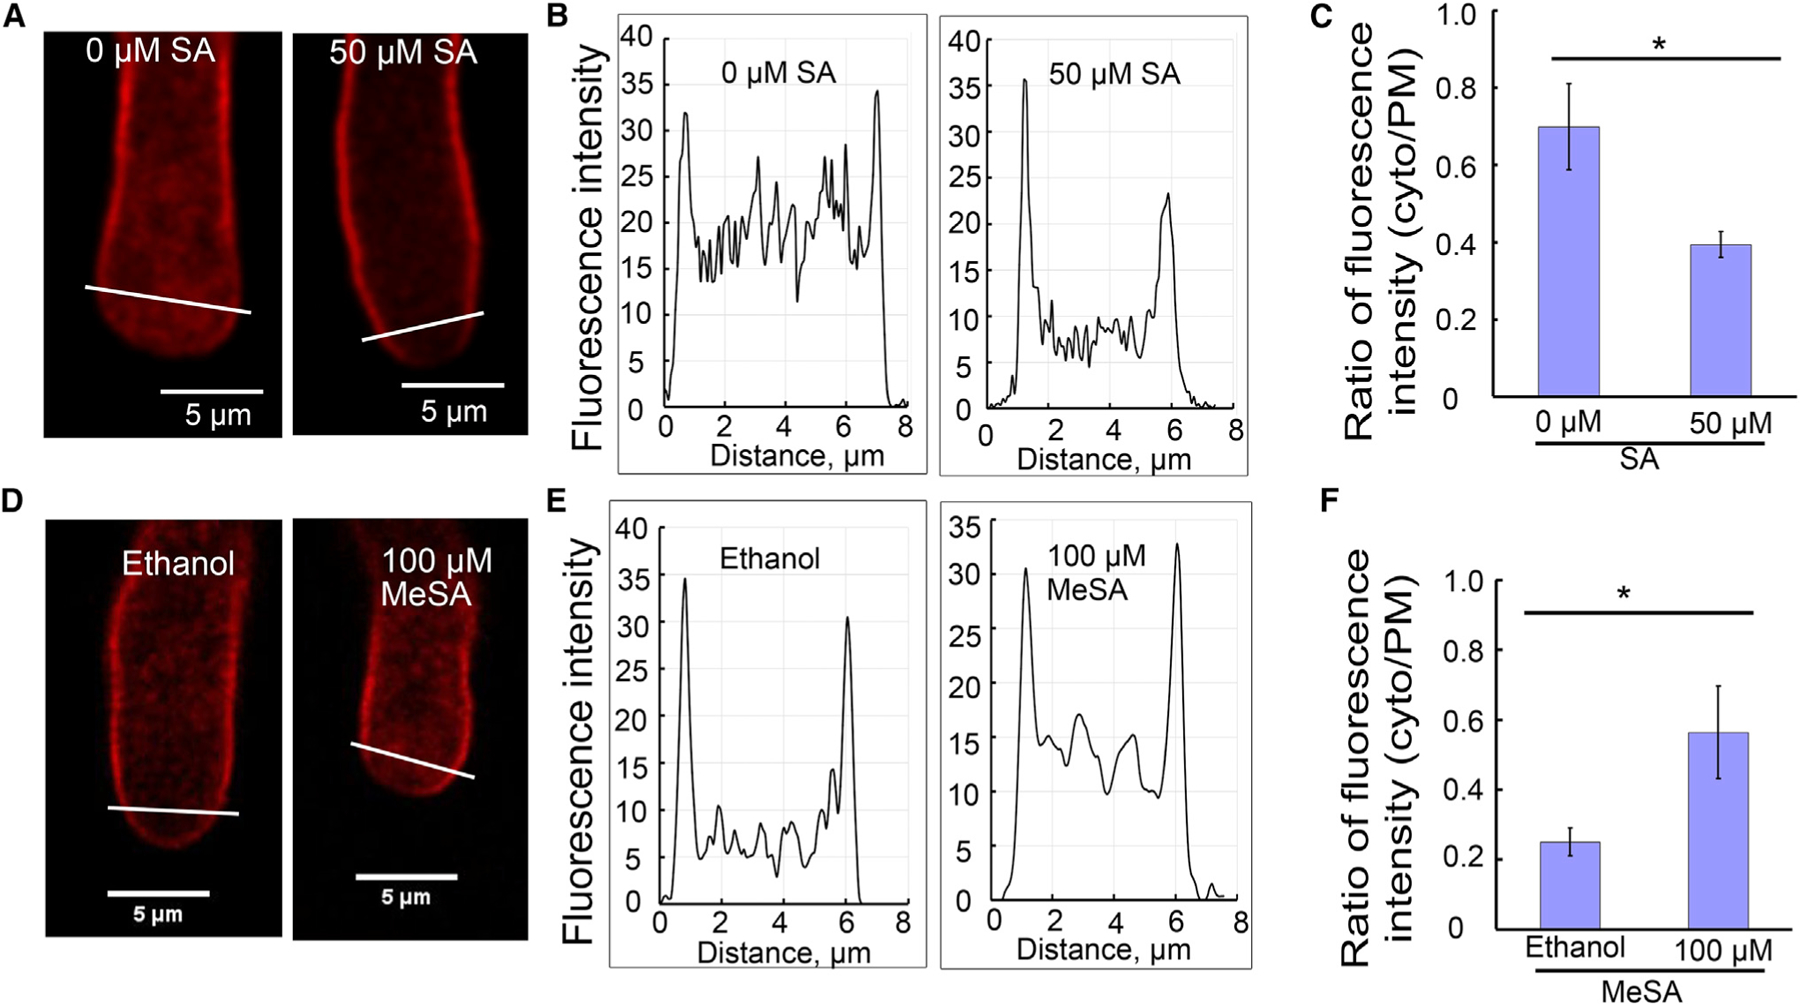
Figure 3. SA and MeSA Act Antagonistically to Regulate Pollen Tube Endocytosis.

FM4–64 staining of pollen tubes treated with SA for 3 min or MeSA for 2 min.
(A and D) Representative visualization of endocytic tracer FM4–64 in pollen tubes, respectively treated with SA (A) and MeSA (D). The white lines across the pollen tube apical region shows the position of endocytosis measured. Scale bars, 5 µm.
(B and E) Representative graphs of fluorescence intensity of FM4–64 in the subapical region of pollen tubes shown in (A), (B), (D), and (E).
(C and F) Average ratio of FM4–64 (5 µM) fluorescence intensity (cytosol/PM) co-treated with SA (t = 3 min, n = 10) or MeSA (t = 2 min, n = 10) in wild-type pollen tubes.
Error bars show ±SEM. *p < 0.05 (Student’s t-test).
