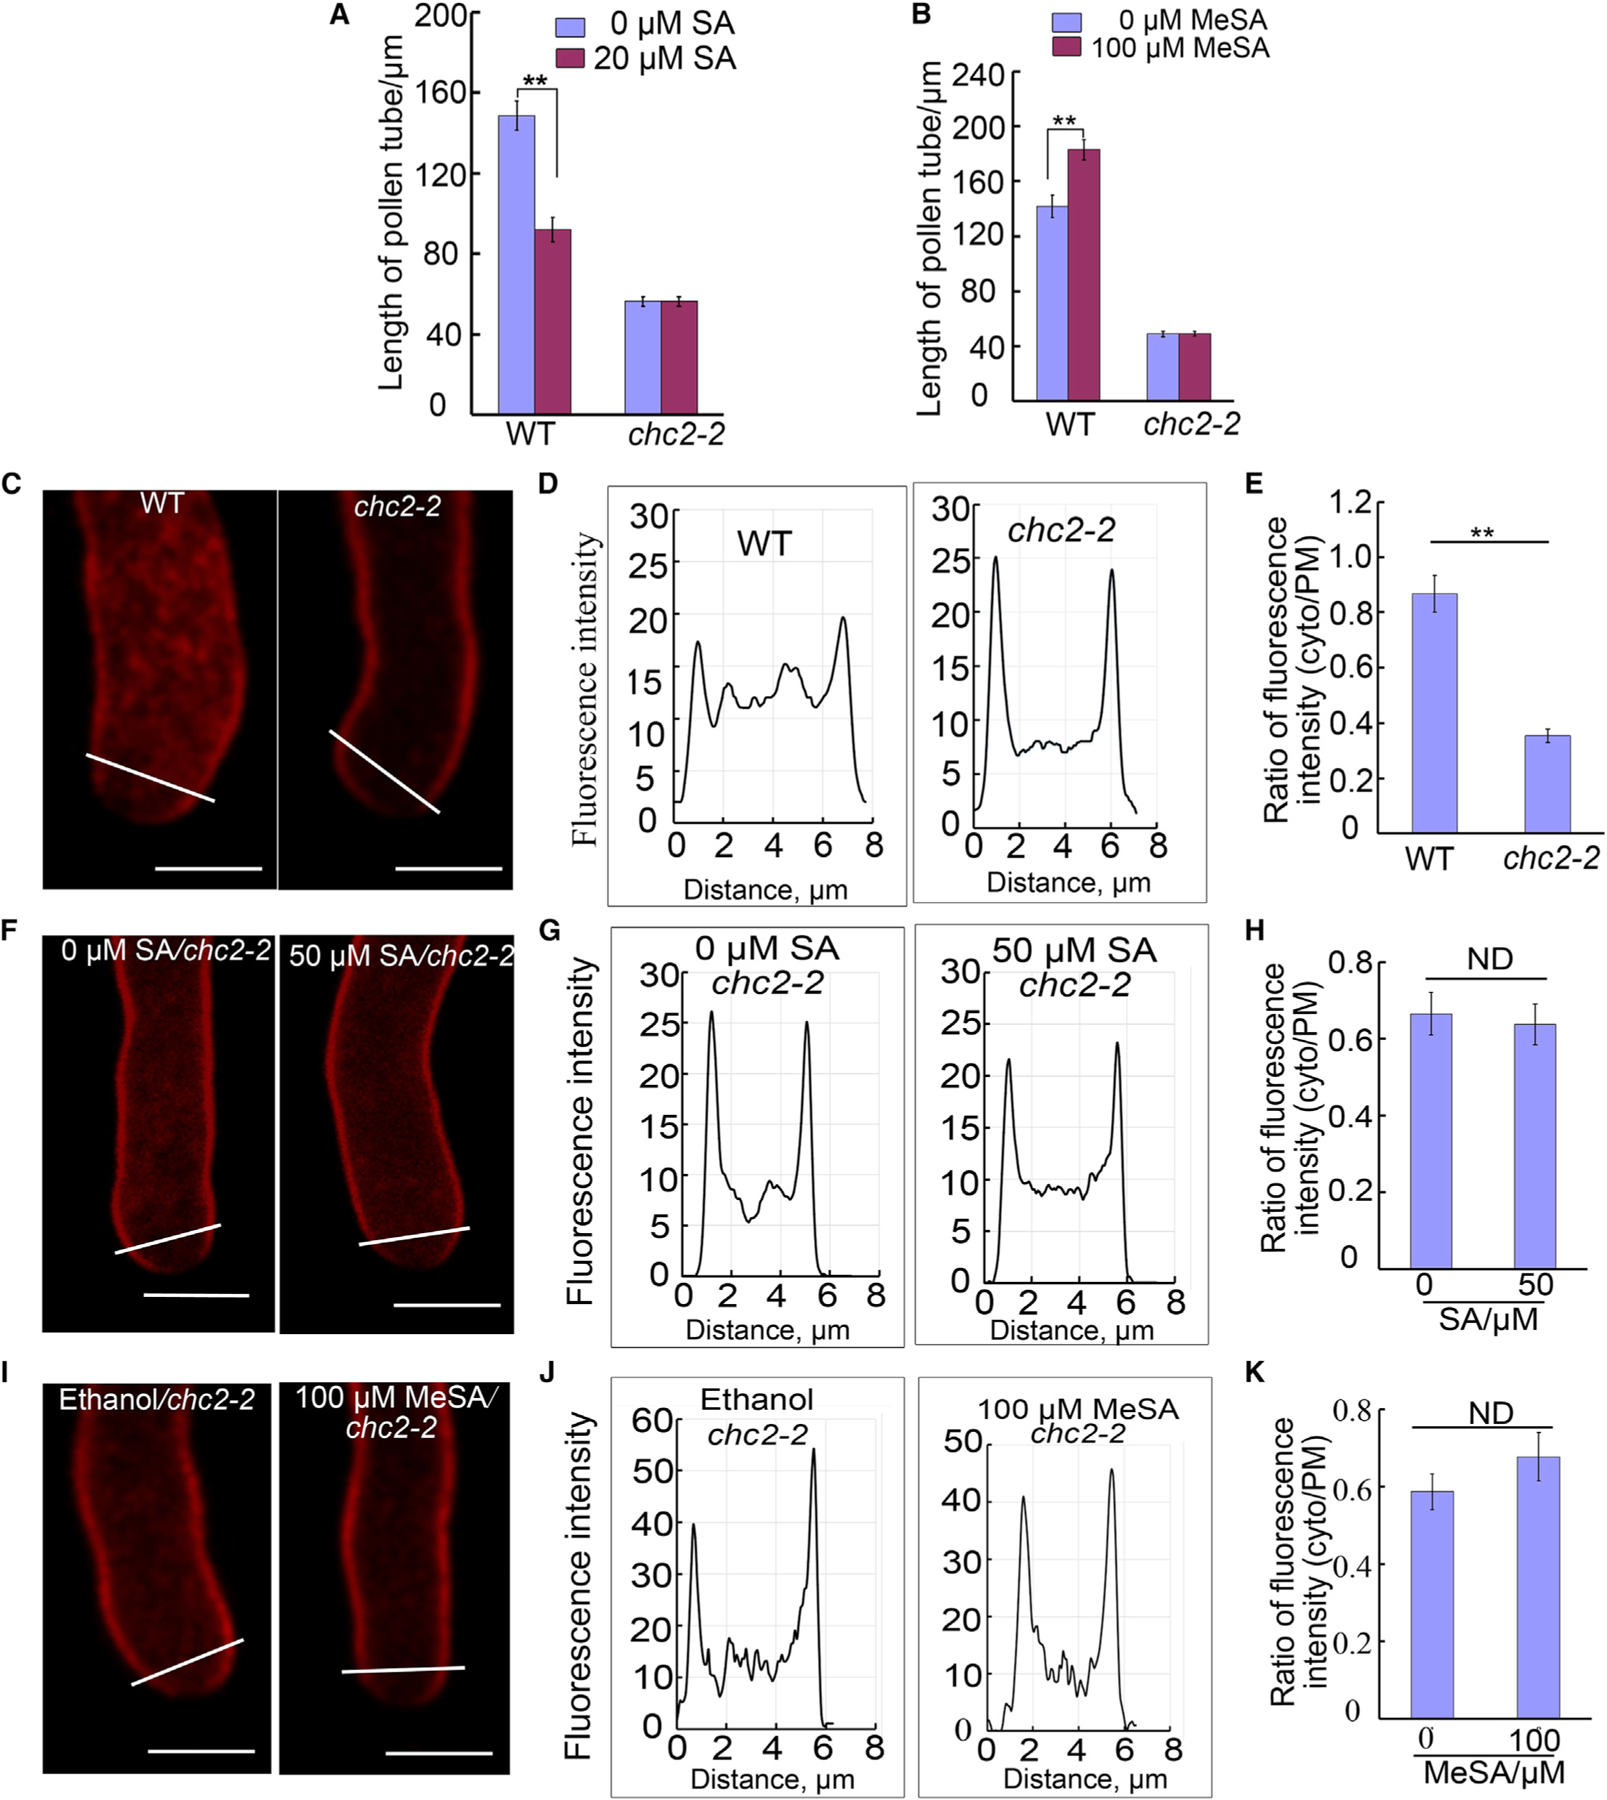
Figure 4. SA and MeSA Affect Clathrin-Mediated Endocytosis in Arabidopsis Pollen Tubes.

(A and B) The length of Col-0 and chc2–2 mutant pollen tubes treated with SA (A) or MeSA (B) for 3 h.
(C–E) FM4–64 staining of Col-0 or chc2–2 pollen tubes. (C) Representative images of pollen tube staining with endocytic tracer FM4–64 in Col-0 or chc2–2 pollen tubes, respectively. Scale bars, 5 µm. (D) Representative graphs showing fluorescence intensity of FM4–64 in the subapical region of pollen tubes for (C). (E) Average ratio of FM4–64 (5 µM) fluorescence intensity (cytosol/PM) in Col-0 (t = 3 min, n = 12) and chc2–2 (t = 3 min, n = 13) pollen tubes.
(F–H) FM4–64 staining of chc2–2 pollen tubes treated without SA or with 50 µM SA. (F) Representative visualization of endocytic tracer FM4–64 for mock (water) or 50 µM SA. Scale bars, 5 µm. (G) Representative graphs of fluorescence intensity of FM4–64 for (F). (H) Average ratio of FM4–64 (5 µM) fluorescence intensity (cytosol/PM) co-treated with mock (t = 15 min, n = 15) or 50 µM SA (t = 15 min, n = 13) in chc2–2 pollen tubes.
(I–K) FM4–64 staining of chc2–2 pollen tubes treated with mock (ethanol) or 100 µM MeSA. (I) Representative visualization of endocytic tracer FM4–64 for mock or 100 µM MeSA. Scale bars, 5 µm. (J) Representative graphs of fluorescence intensity of FM4–64 in pollen tubes for (I). (K) Average ratio of FM4–64 (5 µM) fluorescence intensity (cytosol/PM) co-treated with mock (ethanol; t = 15 min, n = 15) or 1000 µM MeSA (t = 15 min, n = 13) in chc2–2 pollen tubes. Error bars show ±SEM. **p < 0.01 (Student’s t-test), ND, no significant difference.
