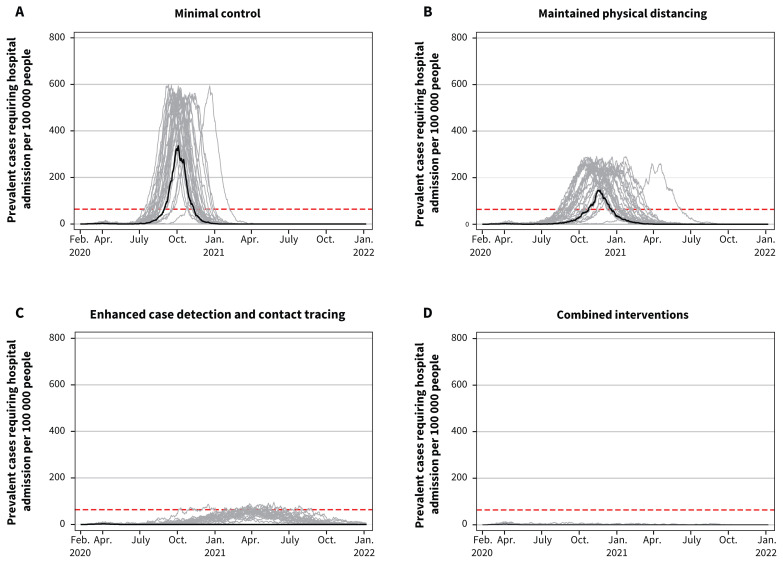
Figure 3:
Projected hospital bed use showing daily hospital admission prevalence per 100 000 people for the 4 scenarios. Note: Prevalent cases include those requiring general hospital admission in addition to those requiring pre–intensive care unit (ICU) and post-ICU hospital admission resulting from coronavirus disease 2019. The maximum Canadian hospital capacity is represented by the dashed horizontal red lines. Median values are represented by the black line. Each grey line represents 1 model realization out of 50 per scenario.

