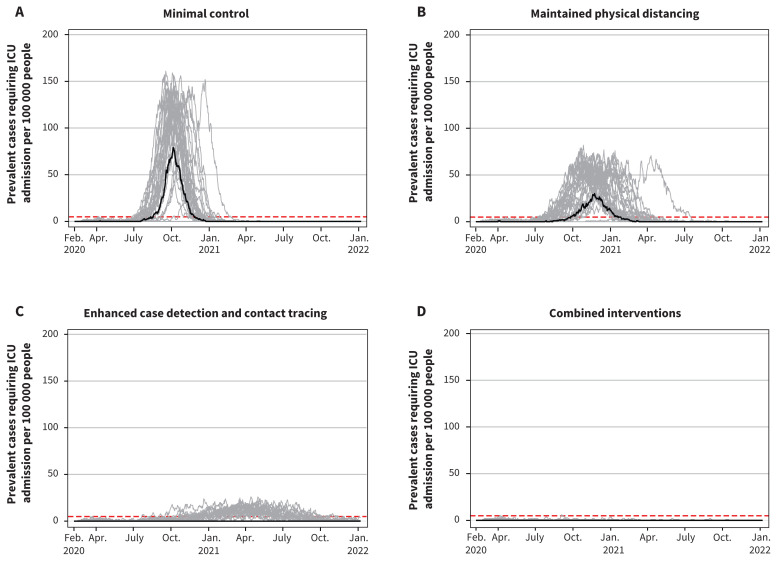
Figure 4:
Projected intensive care unit (ICU) bed use showing daily ICU prevalence per 100 000 people for the 4 scenarios. Note: The maximum Canadian ICU bed capacity is represented by the dashed horizontal red lines. Median values are represented by the black line. Each grey line represents 1 model realization out of 50 per scenario.

