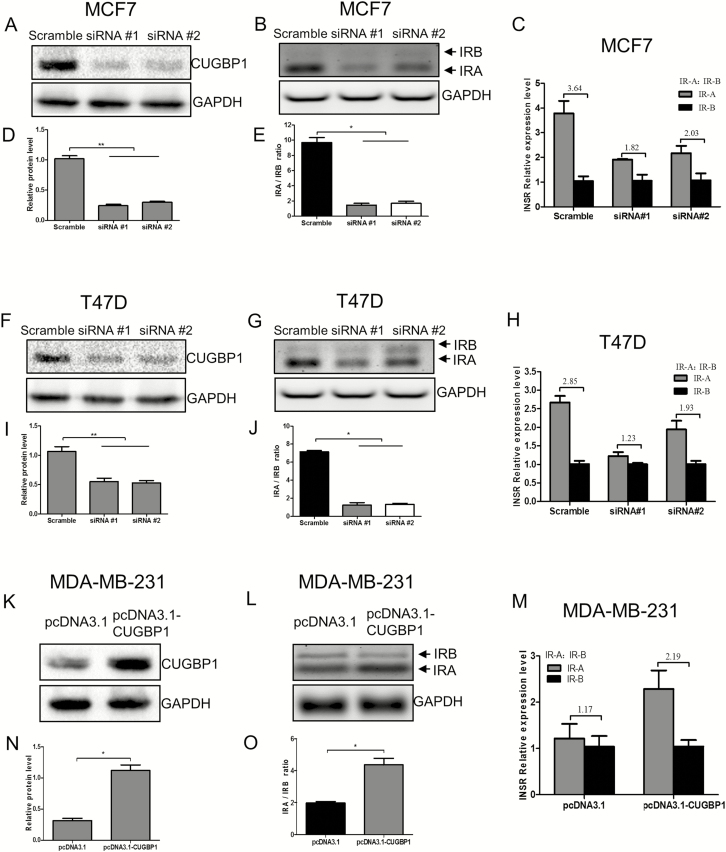
Figure 4.
CUGBP1 regulates IR-A:IR-B ratio in breast cancer cells. (A, D, F, I) Western blotting demonstrated that CUGBP1 protein level was significantly decreased by siRNA-mediated CUGBP1 silencing in MCF7 (A) and T47D cells (F). GAPDH was used as a loading control. Relative protein levels were measured by densitometric analyses normalized to GAPDH (D, I). Data are means ± SEM. **P < 0.01. (B, E, G, J) MCF7 (B) and T47D cells (G) were transfected with control or CUGBP1 siRNA for 24 h, followed by RNA extraction and IR-A and IR-B assessment using RT–PCR. GAPDH served as the loading control. The sizes of IR-B and IR-A were 171 and 135 bp, respectively. IR-A:IR-B ratio was quantified by scanning densitometry (E, J). Results are representative of three separate experiments. *P < 0.05. (C, H) Relative RNA expressions of IR-A and IR-B in MCF7 (C) and T47D cells (H) were measured by real-time PCR. The IR-A:IR-B ratios are shown above the bars. Data are means ± SEM. (K, N) Western blotting demonstrated that CUGBP1 protein level was significantly increased 24 h after pcDNA3.1-CUGBP1 plasmid transfection in MDA-MB-231 cells (K). GAPDH was used as the loading control. Relative protein expressions were measured by densitometric analyses normalized to GAPDH (N). Data are means ± SEM. *P < 0.05. (L, O) MDA-MB-231 cells were transfected with pcDNA3.1 vector or pcDNA3.1-CUGBP1 plasmid for 24 h and IR-A and IR-B isoforms were detected by RT–PCR. GAPDH served as the loading control. The sizes of IR-B and IR-A were 171 and 135 bp, respectively (L). IR-A:IR-B ratio was quantified by scanning densitometry (O). Results are representative of three separate experiments. *P < 0.05. (M) Relative RNA expressions of IR-A and IR-B in MDA-MB-231 cells were measured by real-time PCR. The IR-A:IR-B ratios are shown above the bars. Data are means ± SEM.

