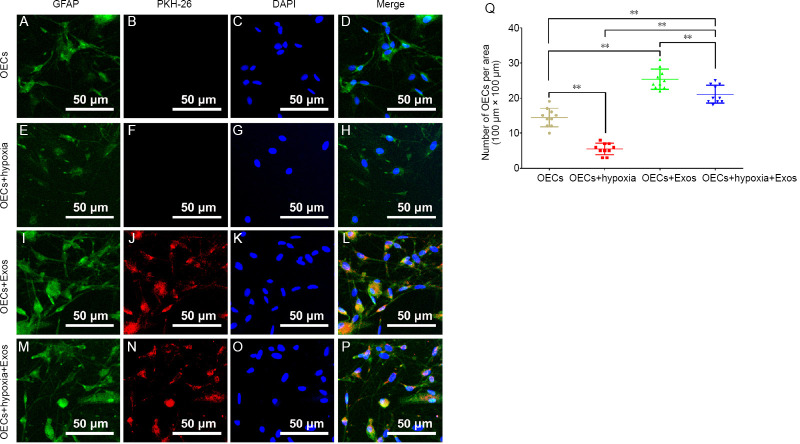
Figure 3.
The effect of HUCMSC exosomes on OECs under hypoxic conditions for 24 hours.
(A–D) Representative images of OECs in normal conditions. (E–H) Representative images of OECs under hypoxic conditions. The number of OECs in the OECs + hypoxia group was the least among the groups. (I–L) Representative images of OECs and exosomes in normal conditions. The number of OECs in the OECs + Exos group was more than that in other groups. (M–P) Representative images of OECs and exosomes under hypoxic conditions. The number of OECs in the OECs + hypoxia + Exos group was more than that in the OECs + hypoxia group. (Q) Quantification of OECs in each group (n = 10 for each group). All data represent the mean ± SEM. **P < 0.01 (one-way analysis of variance followed by Bonferroni’s test). Exos: Exosomes; HUCMSCs: human umbilical cord mesenchymal stem cells; OECs: olfactory enshealting cells.

