Figure 10.

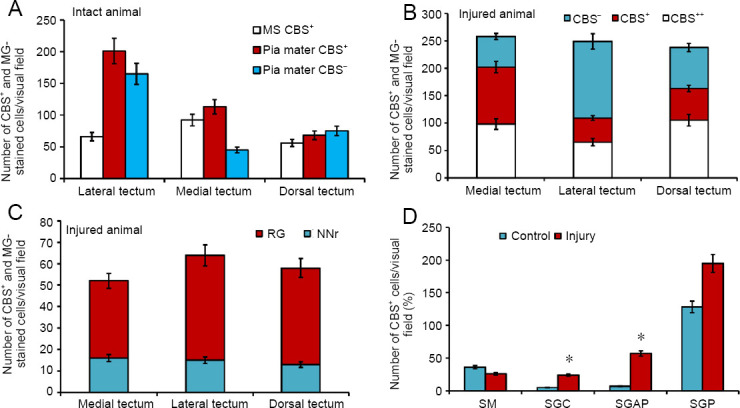
Density of CBS+ cells in the optic tectum of rainbow intact trout Oncorhynchus mykiss and those at 1 week after UEI.
(A) The number of intensively, moderately labeled, and MG-stained cells in intact animals in different parts of the tectum (mean ± SD). (B) The number of intensively, moderately labeled, and MG-stained cells in different parts of the tectum after UEI (mean ± SD). (C) The number of radial glia cells (RG) and reactive neurogenic niches (NNr) in different parts of the tectum after UEI (mean ± SD). (D) The number of cells in intact tectal layers and after UEI; one-way analysis of variance (ANOVA), followed by the Student-Newman-Keuls post hoc test, was used to determine significant differences in control animals and those subjected to UEI (n = 5 in each group; mean ± SD, *P < 0.05, vs. control group). CBS: Cystathionine β-synthase; SGAP: stratum griseum et album periventriculare; SGC: stratum griseum centrale; SGP: stratum griseum periventriculare; SM: stratum marginale; UEI: unilateral eye injury.
