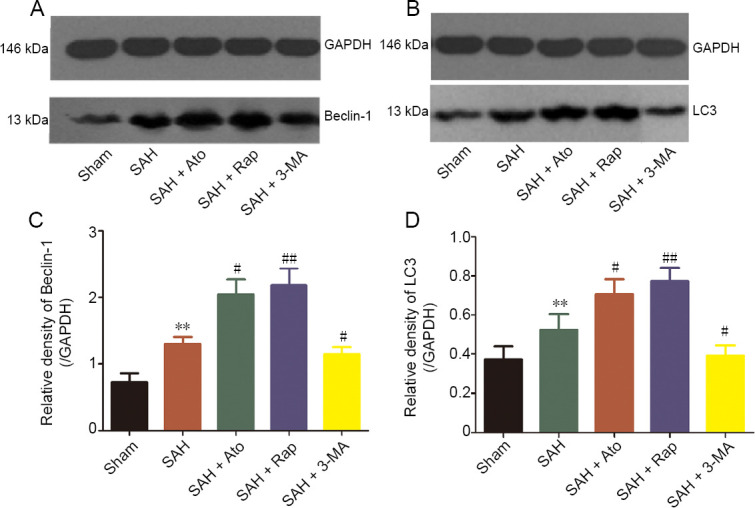
Figure 6.

Autophagy-related protein expression levels in the cerebral cortex.
(A, B) Levels of Beclin-1 (A) and LC3 (B). (C, D) Results of quantitative analysis. The densities of the Beclin-1 (C) and LC3 (D) protein bands were analyzed and normalized to GAPDH. Data are expressed as the mean ± SD (n = 6; one-way analysis of variance). **P < 0.01, vs. sham group; #P < 0.05, ##P < 0.01, vs. SAH group. 3-MA: 3-Methyladenine; Ato: atorvastatin; GAPDH: glyceraldehyde-3-phosphate dehydrogenase; Rap: rapamycin; SAH: subarachnoid hemorrhage.
