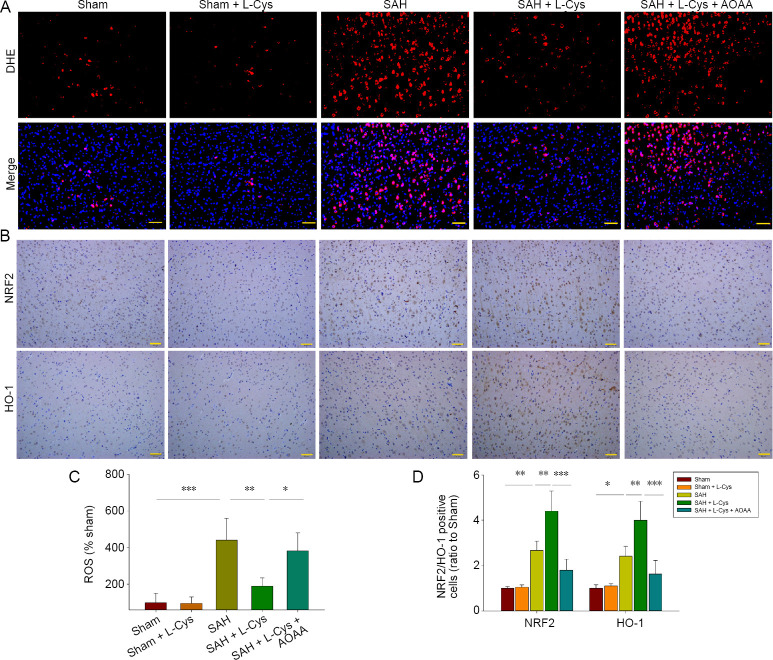
Figure 5.
Effects of L-Cys on ROS and antioxidative stress genes.
(A) DHE-stained images of ROS content at 48 hours after SAH at 20× magnification (n = 4). Scale bar: 50 μm. (B) Immunohistochemistry of NRF2 and HO-1 at 48 hours after SAH at 20× magnification (n = 4). (C) Quantitative analysis of ROS (% sham) at 48 hours after SAH. (D) Quantitative analysis of NRF2/HO-1 expression (ratio to sham) at 48 hours after SAH (mean ± SD, n = 4, one-way analysis of variance followed by Tukey’s post hoc test). Scale bar: 50 μm. *P < 0.05, **P < 0.01, ***P < 0.001. AOAA: Aminooxyacetic acid; DHE: dihydroethidium; HO-1: heme oxygenase-1; L-Cys: L-cysteine; NRF2: nuclear factor erythroid 2 related factor 2; ROS: reactive oxygen species; SAH: subarachnoid hemorrhage.

