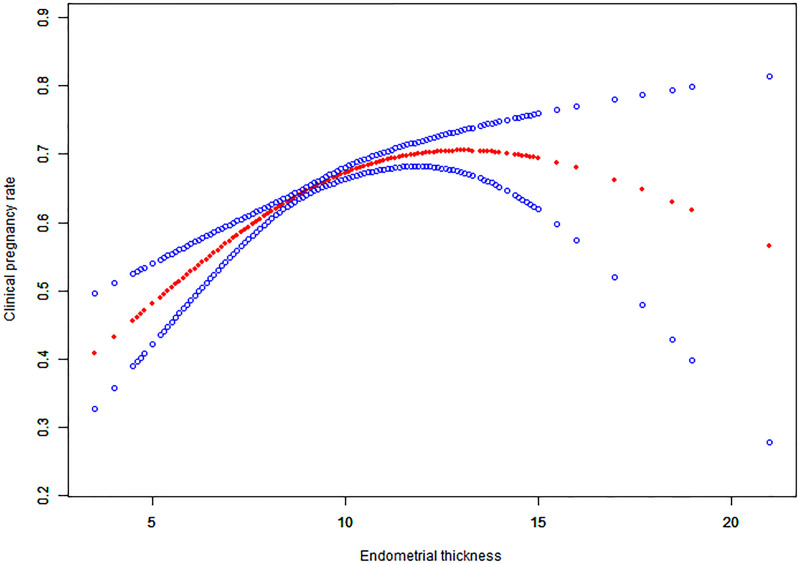
Fig 2. Associations between endometrial thickness and clinical pregnancy rate of HRT-FET cycles.
The threshold was identified, and a nonlinear association between endometrial thickness and the clinical pregnancy rate was found (P<0.001) using a GAM. The solid-dotted red line represents the smooth curve that fits between variables. Blue curves represent the upper and lower limits of the 95% CI. All were adjusted for age, the duration of infertility, body mass index, infertility type, and the number and type of embryos transferred.

