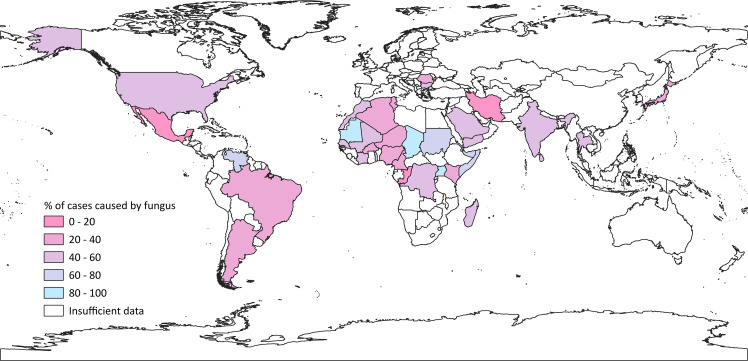
Fig 4. Global map showing the ratio of actinomycetoma to eumycetoma per country, from reported cases.
The bluer colors indicate a higher percentage of eumycetoma, while pinker shades indicate more cases caused by bacterial species. White indicates that information was insufficient in the country (either because there were low numbers of reports or because the reports available did not contain adequate species data).

