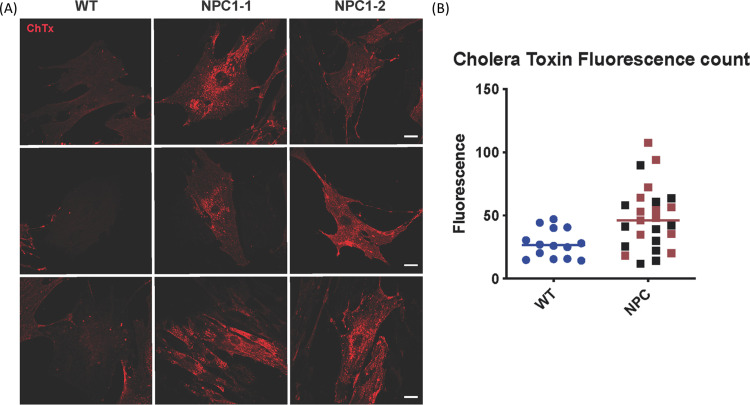
Fig 7. Cholera toxin B staining for GM1 localisation in cells in wildtype Angus fibroblast cells (WT) and affected calves 2 (NPC1-1) and 3 (NPC1-2).
(A) Representative images for cholera toxin staining (red). Scale bar 30 micron. (B) Fluorescence quantification of cholera toxin staining. NPC1-1 (calf 2) is represented in red and NPC1-2 (calf 3) in black. Mean gray value was quantified for each cell with Fiji software.

