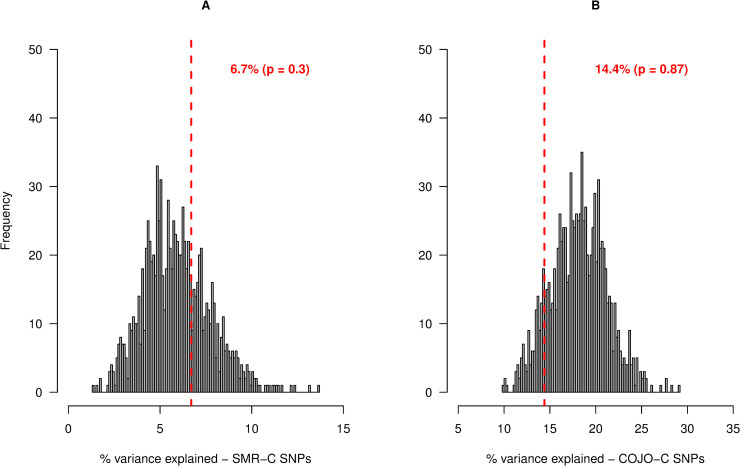
Fig 7. Frequency distribution of the percentage of genetic variance in New Zealand Holstein population, explained by SNPs in 1,000 control tests for SMR-C SNPs.
In each test, the most significant SNPs for stature within a sampled gene-set, that had at least 20 copies of the minor allele in the population were used to construct the first GRM fitted in a GREML model. A second GRM was made with randomly sampled 50k SNPs (excluding SNPs in the first GRM) across the genome, to account for population structure. Figure A shows the result of control analysis for the SMR-C SNPs, in which 80 top SNPs in each gene set were used to construct the first GRM, while figure B shows the result of control analysis for the COJO-C SNPs, in which 391 top SNPs within each gene set was used to construct the first GRM. The red vertical lines represents the percentage of genetic variance explained by the candidate SMR-C and COJO-C SNPs, respectively.

