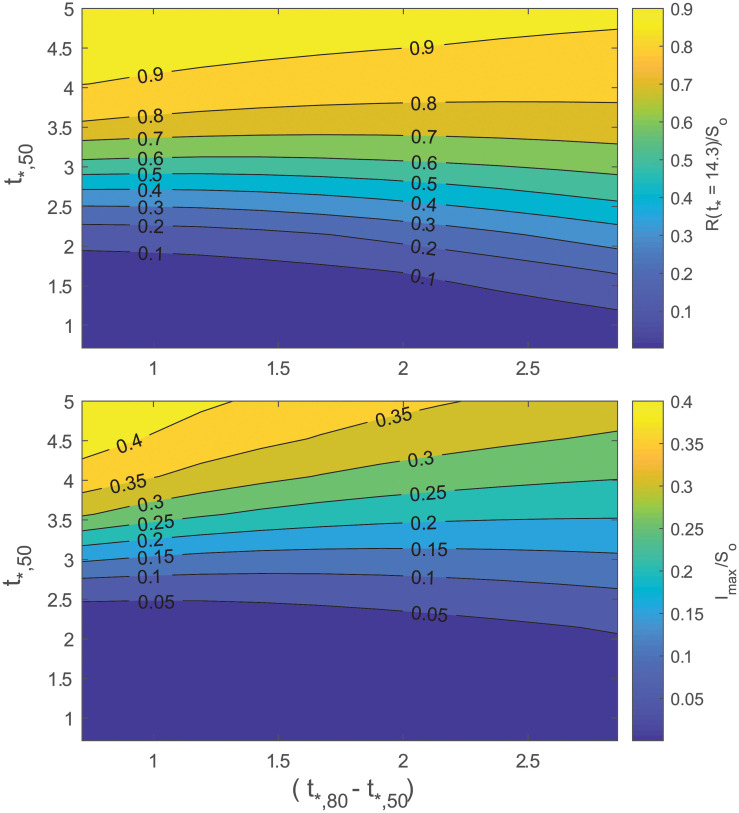
Fig 12. Variation in cumulative number of infected relative to So (top) and in maximum number of infected relative to So (bottom).
The logistic form of Ro was used (Eq (9)). The Ro was set to vary from Ro,c = 4.5 to Ro,u = 1.0. The t*,50 and t*,80 are the dimensionless times at which Ro is half and 80% through the the total decline.

