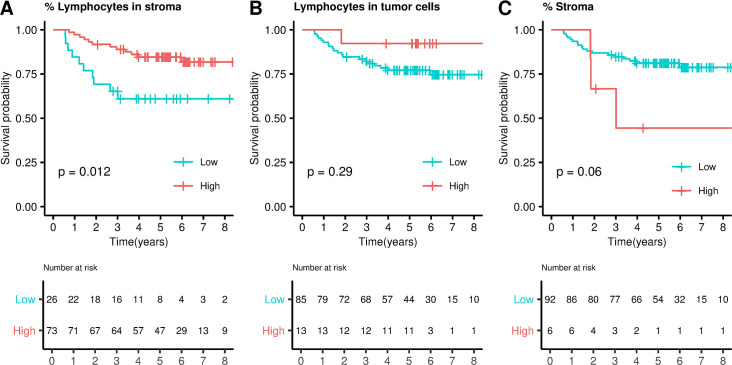
Fig 2. Lymphocytosis measured by a pathologist: survival analysis.
Kaplan–Meier curves dividing samples into high and low lymphocytes categories in stroma (A) and epithelial cells (B). C. Kaplan–Meier curve dividing samples into high and low stromal infiltration. P values were calculated by fitting a Cox regression model adjusted by sex, age, tumor location and stage (IIA, IIB).

