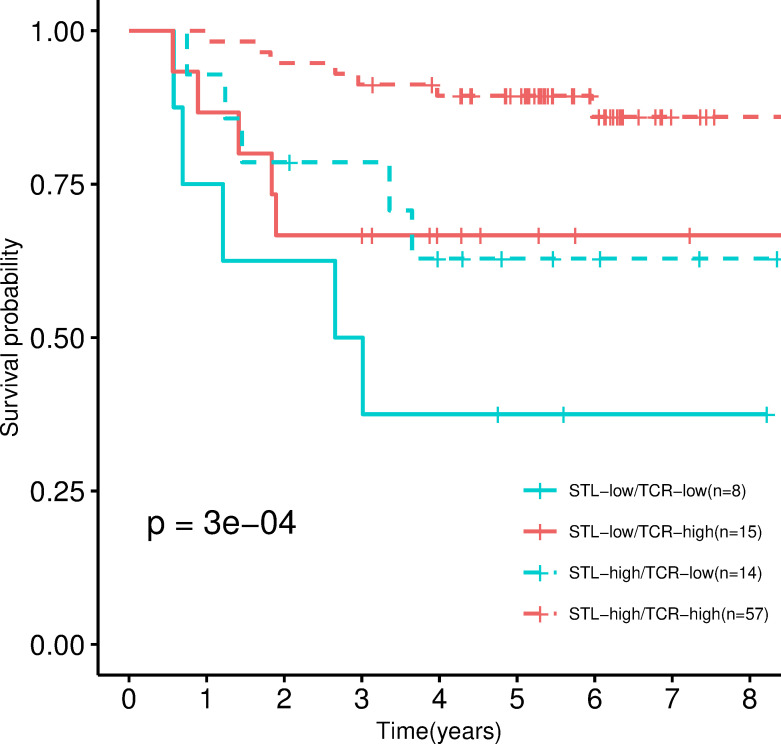
Fig 4. Combination of TCRs and lymphocytosis measures by immunosequencing and by a pathologist.
Kaplan–Meier curve stratified into 4 categories resulting from the combinations of high/low TCR measured by immunoSEQ and high/low STL measured by the pathologist. P values were calculated by fitting a Cox regression model adjusted by sex, age, tumor location and stage (IIA, IIB). STL, stromal lymphocyte; TCR, T-cell receptor.

