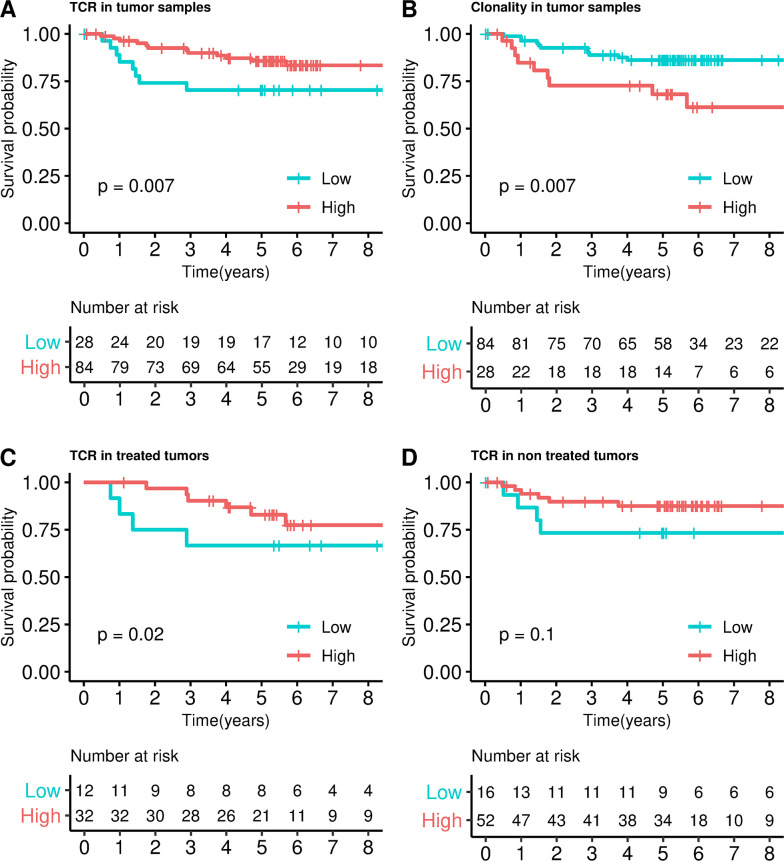
Fig 5. Survival analysis in ICO/FF dataset.
Kaplan–Meier curves dividing into high and low TCRs categories in tumor samples (A), into high and low clonality categories (B); and into high and low TCRs in treated (C) and nontreated samples (D). P values were calculated by fitting a Cox regression model adjusted by sex, age, and stage (IIA, IIB). The same trend was observed in TCR (HR = 0.68, 95% CI 0.51–0.91, P = 0.01) and clonality index (HR = 1.56, 95% CI 0.87–2.80, P = 0.13) when continuous variables were used. CI, confidence interval; FF, fresh frozen; HR, hazard ratio; ICO, Catalan Institute of Oncology; TCR, T-cell receptor.

