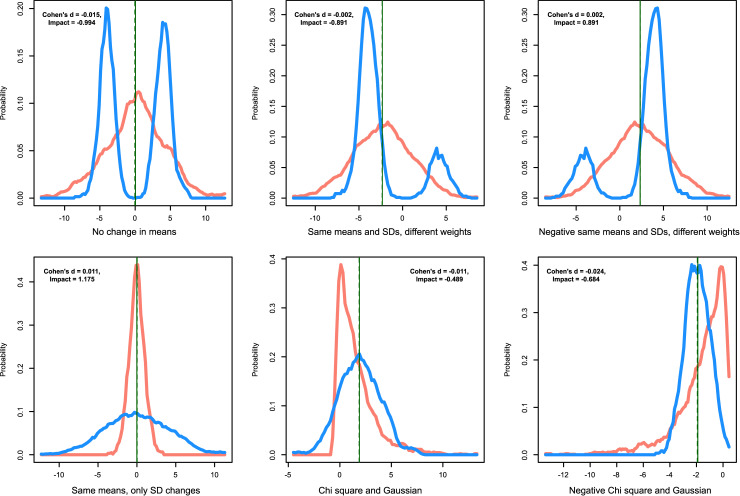
Fig 2. Artificial data where the two groups (red and blue) display no differences in mean but possess clearly different data distributions (data set 1).
The axis legend of the abscissa indicates the kind of data distributions underlying the groups. The density distribution is presented as probability density function (PDF), estimated by means of the Pareto Density Estimation (PDE [15]). The perpendicular lines indicate the means for both data subsets (solid and dashed green lines). The means are numerically identical but have been optically separated by one pixel. The figure has been created using the R software package (version 3.6.3 for Linux; http://CRAN.R-project.org/ [25]) using our R package “ImpactEffectsize” (https://cran.r-project.org/package=ImpactEffectsize).

