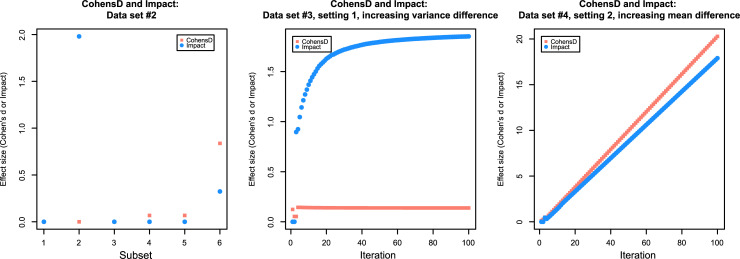
Fig 3. Dot plots of the effect sizes expressed as Cohen’s d and “Impact”calculated for artificially created data sets (data sets 2 and 3) comprising subsets of each of two groups (red and blue) with identical sizes of n = 100.
Left panel: Data set 2 in which subsets X1 had only one value (xi = 1) in all cases and groups. In the second subset X2, one group contained always the value of x = 1 and the other group always the value of x = 2. In the third subset X3, the sequence [1,…,5] was repeated 20 times, so that both groups were identical and contained the even numbers from 1 to 5 at equal frequencies. In the fourth subset X4, the groups were created by random sampling with replacement from sequences [1,…,100], independently for each group. The fifth subset was X5 = 10 · X4 to study the scale-independency of “Impact”. In the sixth subset X2 group 1 contained always a value of 1 while group 2 was created as 100 values from a normal distribution with mean = 2 and standard deviation = 2. Middle panel: Data set 3 with several iteratively created data subsets with groups with the same mean but increasing variance in one but not the other group. Right panel: Data set 3 with several iteratively created data subsets with groups with the same variance but increasing mean in one but not the other group. The figure has been created using the R software package (version 3.6.3 for Linux; http://CRAN.R-project.org/ [25]) using our R package “ImpactEffectsize” (https://cran.r-project.org/package=ImpactEffectsize).

