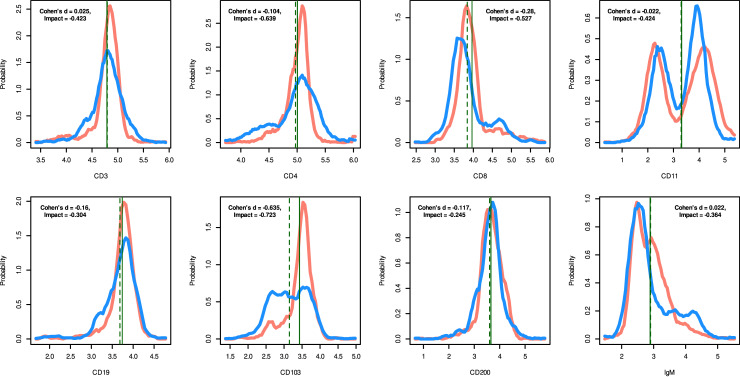
Fig 5. Biomedical data of a hematological context comprising a flow cytometry-based lymphoma makers CD3, CD4, CD8, CD11, CD19, CD103, CD200 and IgM comprising of one subset of n = 1,494 cells from healthy subjects (red) and a second set of n = 1,302 cells from lymphoma patients (blue) (data set 6).
The density distribution is presented as probability density function (PDF), estimated by means of the Pareto Density Estimation (PDE [15]). The perpendicular lines indicate the means for both data subsets (solid and dashed green lines). The figure has been created using the R software package (version 3.6.3 for Linux; http://CRAN.R-project.org/ [25]) using our R package “ImpactEffectsize” (https://cran.r-project.org/package=ImpactEffectsize).

