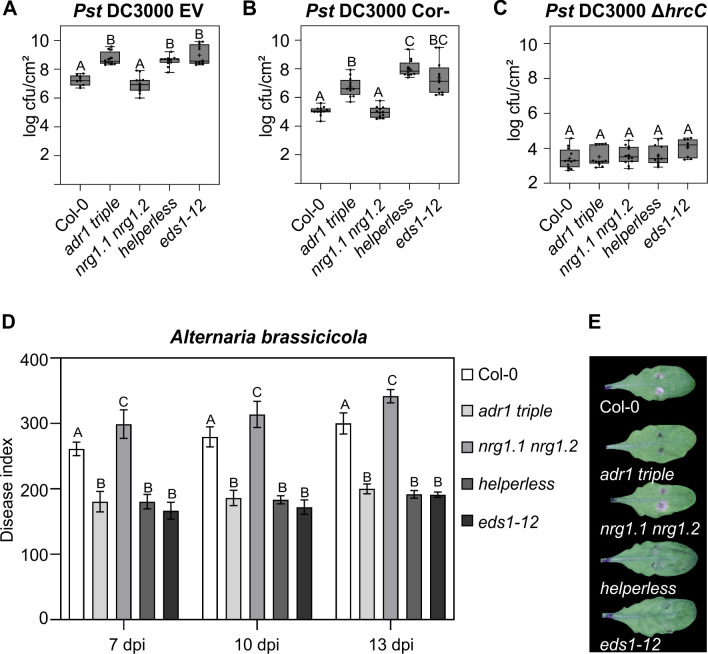
Fig 3. Unequally redundant and specific functions of RNLs during basal resistance and resistance against a necrotrophic pathogen.
(A, B, C) Six-week-old plants were hand-infiltrated with (A) Pst DC3000 EV (OD600 = 0.001), (B) Pst DC3000 cor- (OD600 = 0.002), or (C) Pst DC3000 ∆hrcC (OD600 = 0.002), and bacterial growth was assessed at 3 dpi. Dots represent 12 data points (3 biological replicates and 4 technical replicates). Box limit represents upper and lower quartile; maximum and minimum values are displayed in whiskers. The middle line shows the median, the cross the mean cfu/cm2. Letters indicate statistically significant differences following ANOVA with Tukey’s test (α = 0.05). (D) 5.5-week-old plants were inoculated with 1 × 10⁶ spores/mL A. brassicicola, and disease symptoms were monitored at 7, 10, and 13 dpi. DIs are shown as mean ± SEM of at least 35 replicates of 2 independent experiments. Letters indicate statistically significant differences at one time point following ANOVA with Tukey’s test (α = 0.05). (E) Pictures of representative leaves inoculated with two 5 μL droplets of A. brassicicola spores were taken 13 dpi. Underlying numerical data are provided in S1 Data. cfu, colony-forming units; DI, disease index; dpi, days post infection; EV, empty vector; hrcC, HR and pathogenicity gene C; OD600, optical density at 600 nm; Pst, Pseudomonas syringae pv. tomato.

