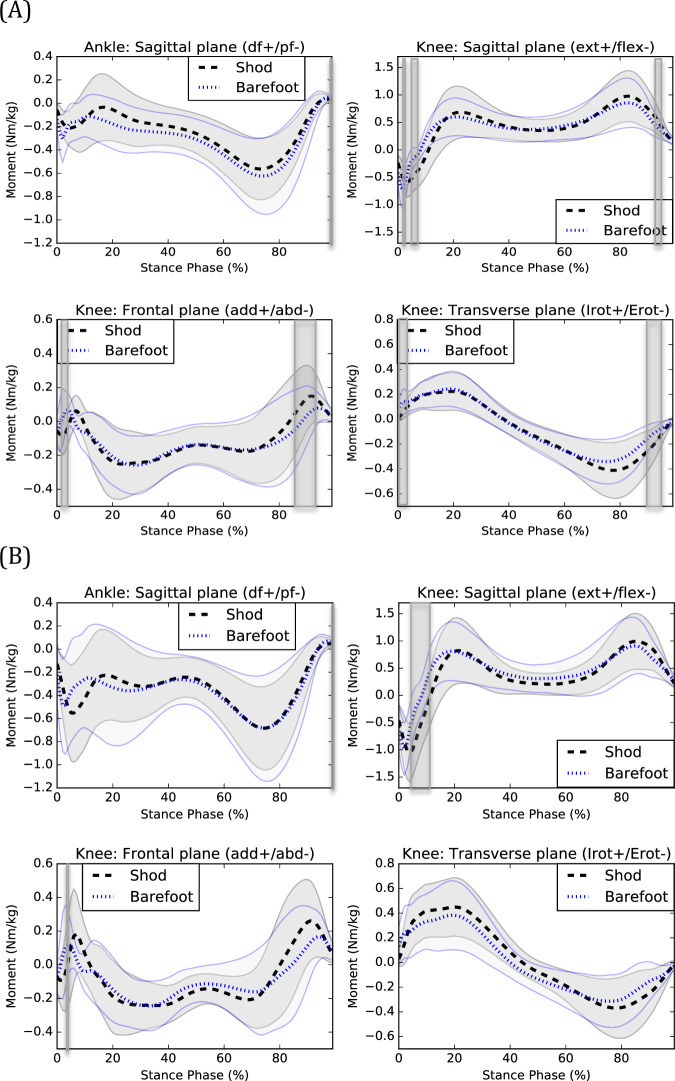
Fig 2.
Kinetics of shod and barefoot walking during (A) CW and (B) FW. Means of the shod (black) and barefoot (blue) conditions are respectively represented by dotted lines and standard deviations are observed between the full lines. Significant between-group differences are observed in the shadowed region. df: dorsiflexion, pf: plantarflexion, ext: extension, flex: flexion, add: adduction, abd: abduction, Irot: internal rotation, Erot: external rotation.

