
Fig 3. Comparison of the change rates of the T-cell Subsets between the last and first T cell subsets tests.
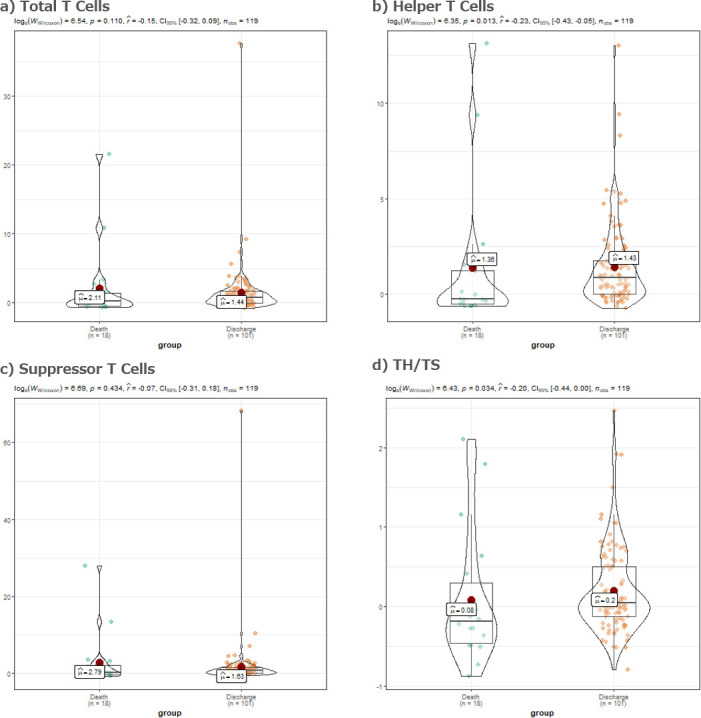
a) Violin plot of the total T cells change rates between the last and the first T-cell Subsets tests during the hospitalization. Wilcoxon-Mann-Whitney test comparing the means of the two groups yielded a p value of 0.110. b) Violin plot of the helper T cells change rates between the last and the first T-cell Subsets tests during the hospitalization. Wilcoxon-Mann-Whitney test comparing the means of the two groups yielded a p value of 0.013. c) Violin plot of the suppressor T cells change rates between the last and the first T-cell Subsets tests during the hospitalization. Wilcoxon-Mann-Whitney test comparing the means of the two groups yielded a p value of 0.434. d) Violin plot of the total TH/TSC ratio change rates between the last and the first T-cell Subsets tests during the hospitalization. Wilcoxon-Mann-Whitney test comparing the means of the two groups yielded a p value of 0.034.