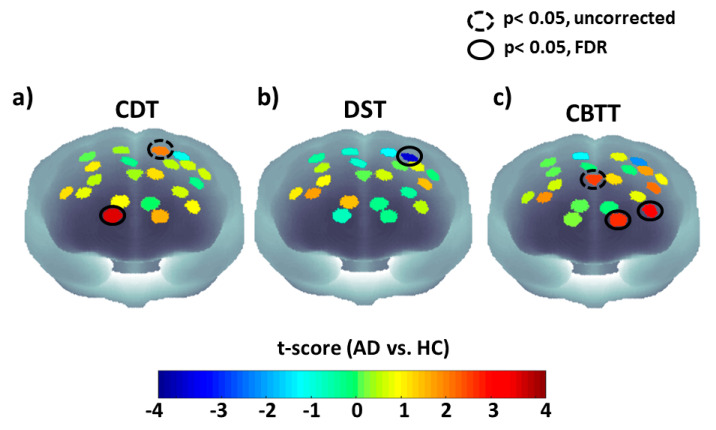
Figure 3.
Statistical maps (t-scores) of AD vs. HC for signal complexity of fNIRS for the three experimental phases. Dashed black circles shows significant channels (p < 0.05), that did not survive FDR correction, whereas continuous black circles show channels that were still significant (p < 0.05) after multiple comparison correction. (a) t-score maps (AD vs. HC) based on the SampEn metric during CDT. (b) t-score maps (AD vs. HC) based on the SampEn metric during DST. (c) t-score maps (AD vs. HC) based on the MSE (τ = 3) metric during CBTT.

