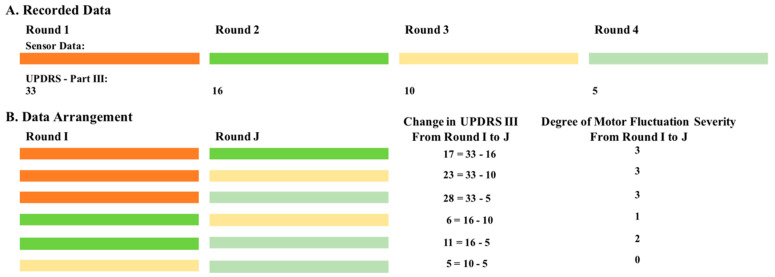
Figure 2.
A diagram demonstrating the data arrangement into pairs of rounds in case of subject #1. (A) Four rounds of data along with their associated UPDRS III scores are shown. (B) All the possible pairs of rounds along with their associated change in UPDRS III scores and degree of motor fluctuation severity (0: minimal; 1: mild; 2: moderate; and 3 severe).

