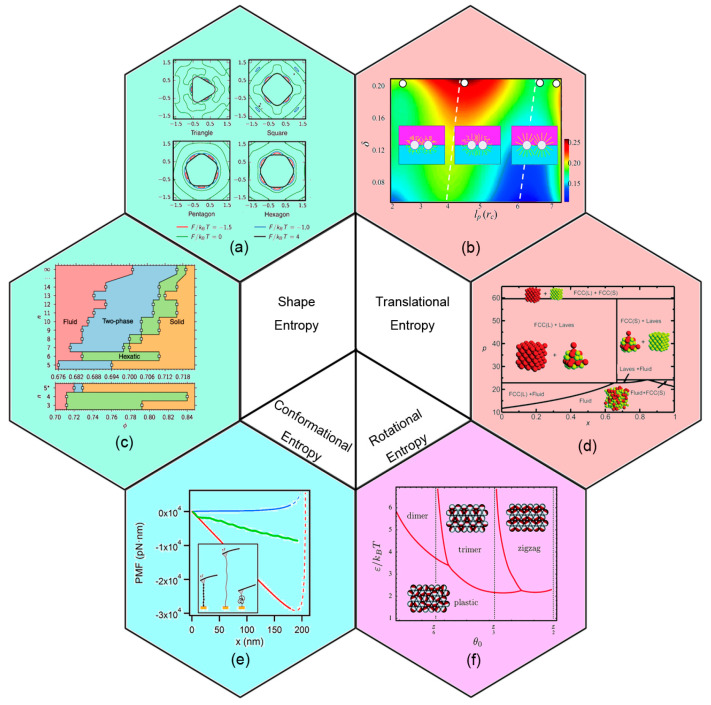
Figure 2.
Typical entropy types used in self-assembly. (a) A contour plot of potential of mean force and torque plots for polygons at the highest density point of isotropic fluid. (b) Mixing parameter as a function of persistence length of tethers lp, and the compression ratio caused by mixing entropy. Reproduced with permission from ref. [31] Copyright 2013, The Royal Society of Chemistry. (c) Phase diagram of hard polygon melting behavior, which is controlled by shape entropy. (d) Phase diagram for a binary hard-sphere mixture with size ratio q = 0.82 in the reduced pressure p and the number fraction of small spheres x. Reproduced with permission from ref. [25] Copyright 2015, The Springer Nature. (e) Conformation and elasticity of modular proteins at different external force condition. The free energy landscape (FEL) of unfolding (green line), stretching (red line), and collapse-refolding (blue line) conformation of polyubiquitin was measured by AFM. Reproduced with permission from ref. [33] Copyright 2017, The American Chemical Society. (f) Patchy particles rotates to assemble. Phase diagram in terms of the patch size q0 and reduced attraction strength ε/kBT, at a reduced pressure p =50. Reproduced with permission ref. [32] Copyright 2015, The Royal Society of Chemistry. (a) and (c) are reproduced with permission ref. [34] Copyright 2017, The American Physical Society.

