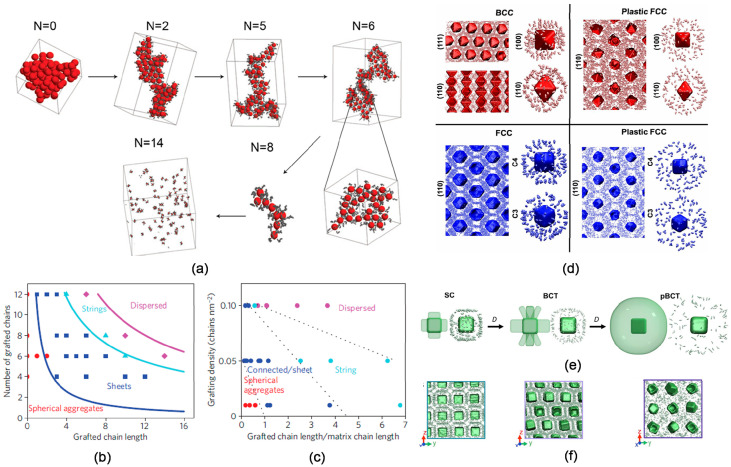
Figure 8.
(a)–(c) Anisotropic structures of hieratical self-assembly of spherical polymer-grafted nanoparticles (a) Simulation snapshots of particles with different grafted chain length N, where six polymer chains were uniformly grafted onto spherical surface. Phase diagram of polymer-grafted particle obtained from (b) numerical simulations and (c) experiments, with grafted chain length versus number of grafted chains (grafted density), where the morphologies are classified by color symbol: spheres (red), sheets (dark blue), strings (light blue), and well-dispersed particles (magenta). The solid or dash lines that separate the different regions are merely guides to the eye. Reproduced with permission from ref. [73] Copyright 2015, The Springer Nature. (d)–(f) MD simulations of self-assembly of DNA-sticky polyhedral. (d) The spatial distribution of DNA sticky ends is shown for BCC, plastic BCC, FCC, and plastic FCC phase, where the DNA is localized between particles for the crystalline phase and more isotropically distributed for the plastic phase. (e) A model (left) and image (right) from an MD simulation are shown to indicate the distribution of DNA sticky ends in each plane, as D increases in these systems, where the distribution of DNA ligands breaks symmetry along the (001). (f) MD simulations along particular crystallographic planes reveal the distribution of DNA sticky ends between particles. Planes shown in (e) and (f) are (100) for SC, (100) for BCT, and (110) for the plastic BCT. Reproduced with permission from ref. [74] Copyright 2016 National Academy of Sciences.

