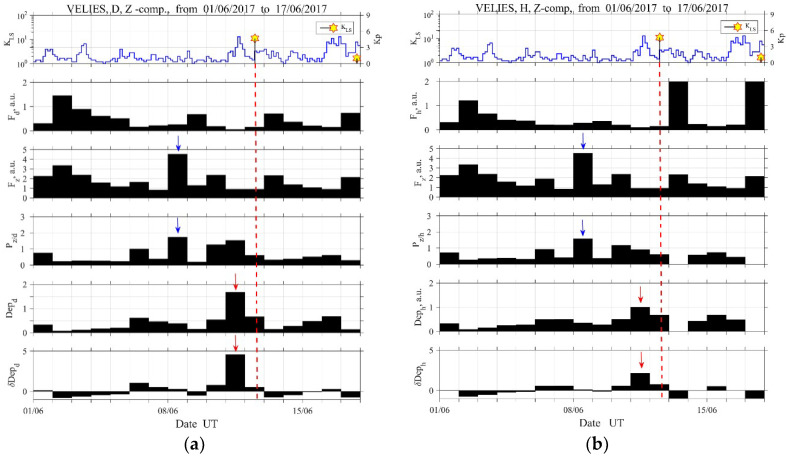
Figure 3.
Analysis results for a short period of 1–17 June 2017 at Velies (VLI) for D, Z components (a) and H, Z components (b). In each figure, top panel indicates the temporal evolutions of geomagnetic activity () and seismic activity (). The second and third panels refer to the mean power of the horizontal ( or ) and vertical components (), and the fourth, to their ratio (polarization) ( or ). The fifth panel refers to the inverse of the mean power of the horizontal component (the horizontal depression, or ) and the bottom one to its relative change ( or ). Vertical dashed lines mark the time of occurrence of the 2017 Lesvos EQ. (For the interpretation of the references to colors, the reader is referred to the online version of this paper).

