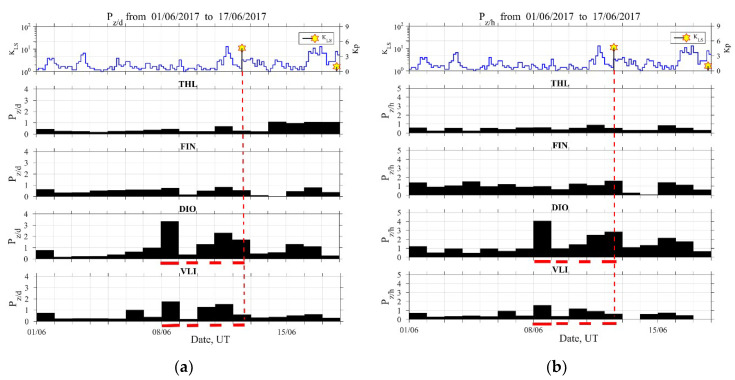
Figure 4.
Evolution of the lithospheric ultra-low frequency (ULF) quantities (a) and (b) in all four observation sites. Top panel is similar to the top panel of Figure 3. Vertical dashed lines mark the time of occurrence of the 2017 Lesvos EQ. Horizontal dashed lines mark a noticeable increase of these quantities at the nearest DIO station, which is also present, although at a lower level, in the distant station VLI.

